KARAKORUM_SIACHEN


Location

lon / lat [deg]: 77.02 / 35.48

Source network: ALBEDOVAL2


Geostationary surface albedo (GSA) data


“+000”


“+057/+063”


Landcover information (based on ESA CCI landcover data)


Landcover fractions @ 2km distance


Landcover fractions @ 20 km distance


Legend


Distance to open water bodies [km]:

7.08

Distance to urban areas [km]:

33.68


Radius: 1 km

Number of landcover classes:

1

Dominant landcover type:

220: permanent snow and ice

Fraction of dominant landcover type [%]:

100.0


Radius: 2 km

Number of landcover classes:

1

Dominant landcover type:

220: permanent snow and ice

Fraction of dominant landcover type [%]:

100.0


Radius: 5 km

Number of landcover classes:

1

Dominant landcover type:

220: permanent snow and ice

Fraction of dominant landcover type [%]:

100.0


Radius: 10 km

Number of landcover classes:

1

Dominant landcover type:

220: permanent snow and ice

Fraction of dominant landcover type [%]:

99.0


Radius: 20 km

Number of landcover classes:

1

Dominant landcover type:

220: permanent snow and ice

Fraction of dominant landcover type [%]:

100.0


Disturbances


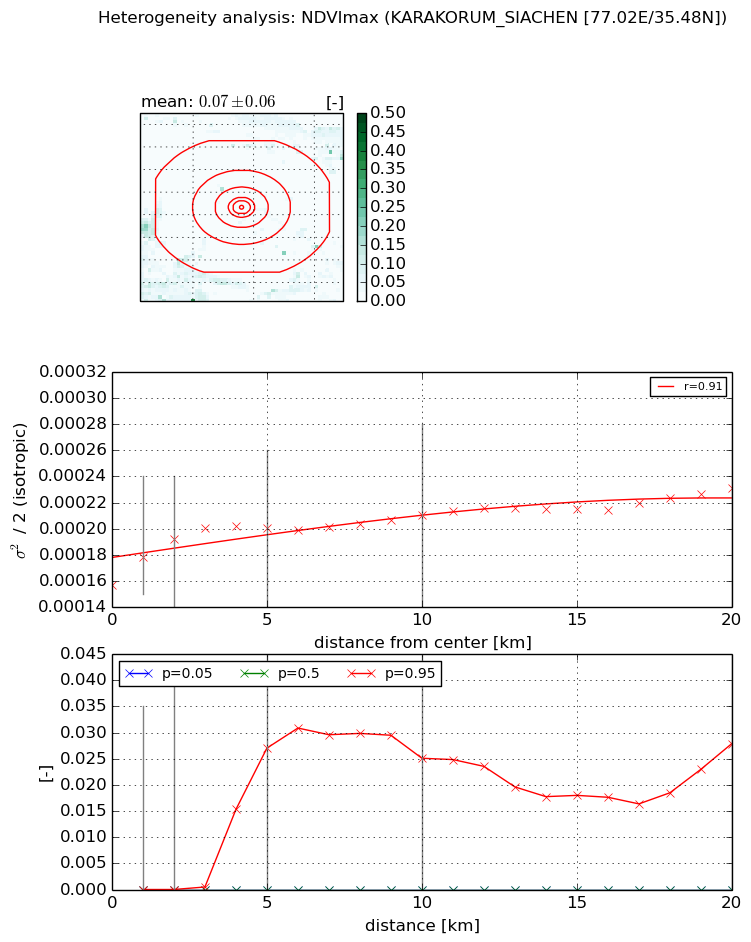
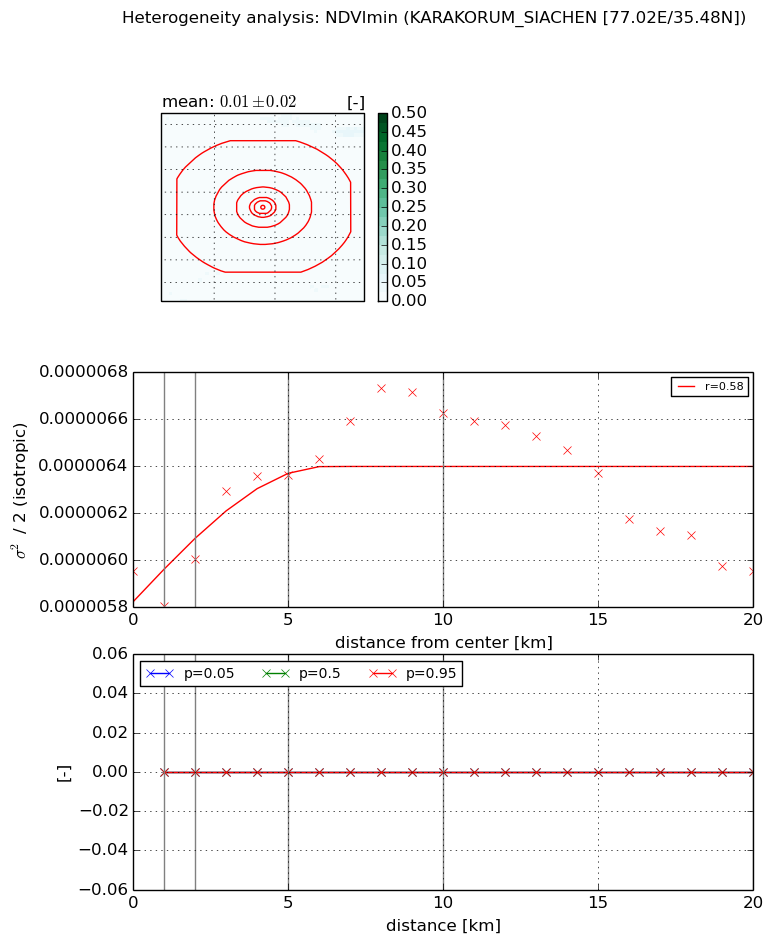
Heterogeneity analysis

The heterogeneity analysis provides information about the spatial and temporal heterogeneity of the site.

Topography


Roman et al. (2009) index


St

7.03463454492e-06

Rcv

1.73566349375

Rse

0.0

Rst

0.0013354893801

Rsv

426459.649281


Height range @ 1km [m]

38

Height range @ 2km [m]

99

Height range @ 5km [m]

665

Height range @ 10km [m]

-999

Height range @ 20km [m]

-999


Variance slope @ 1 km

14762

Variance slope @ 2 km

15715

Variance slope @ 5 km

12777

Variance slope @ 10 km

-999

Variance slope @ 20 km

-999


NDVI (max. NDVI composite)


Roman et al. (2009) index


St

nan

Rcv

nan

Rse

nan

Rst

nan

Rsv

nan


NDVI range @ 1km [-]

0.0

NDVI range @ 2km [-]

0.0

NDVI range @ 5km [-]

0.03

NDVI range @ 10km [-]

0.03

NDVI range @ 20km [-]

0.03


Variance slope @ 1 km

2.17200533826e-05

Variance slope @ 2 km

1.78738885256e-05

Variance slope @ 5 km

8.53045549941e-06

Variance slope @ 10 km

3.80203030486e-06

Variance slope @ 20 km

2.38988371244e-06


NDVI (min. NDVI composite)I


Roman et al. (2009) index


St

nan

Rcv

nan

Rse

nan

Rst

nan

Rsv

nan


NDVI range @ 1km [-]

0.0

NDVI range @ 2km [-]

0.0

NDVI range @ 5km [-]

0.0

NDVI range @ 10km [-]

0.0

NDVI range @ 20km [-]

0.0


NDVI slope @ 1 km

-1.5161551462e-07

NDVI slope @ 2 km

2.49759188274e-08

NDVI slope @ 5 km

1.1385562734e-07

NDVI slope @ 10 km

8.95784518599e-08

NDVI slope @ 20 km

-4.89309131125e-10


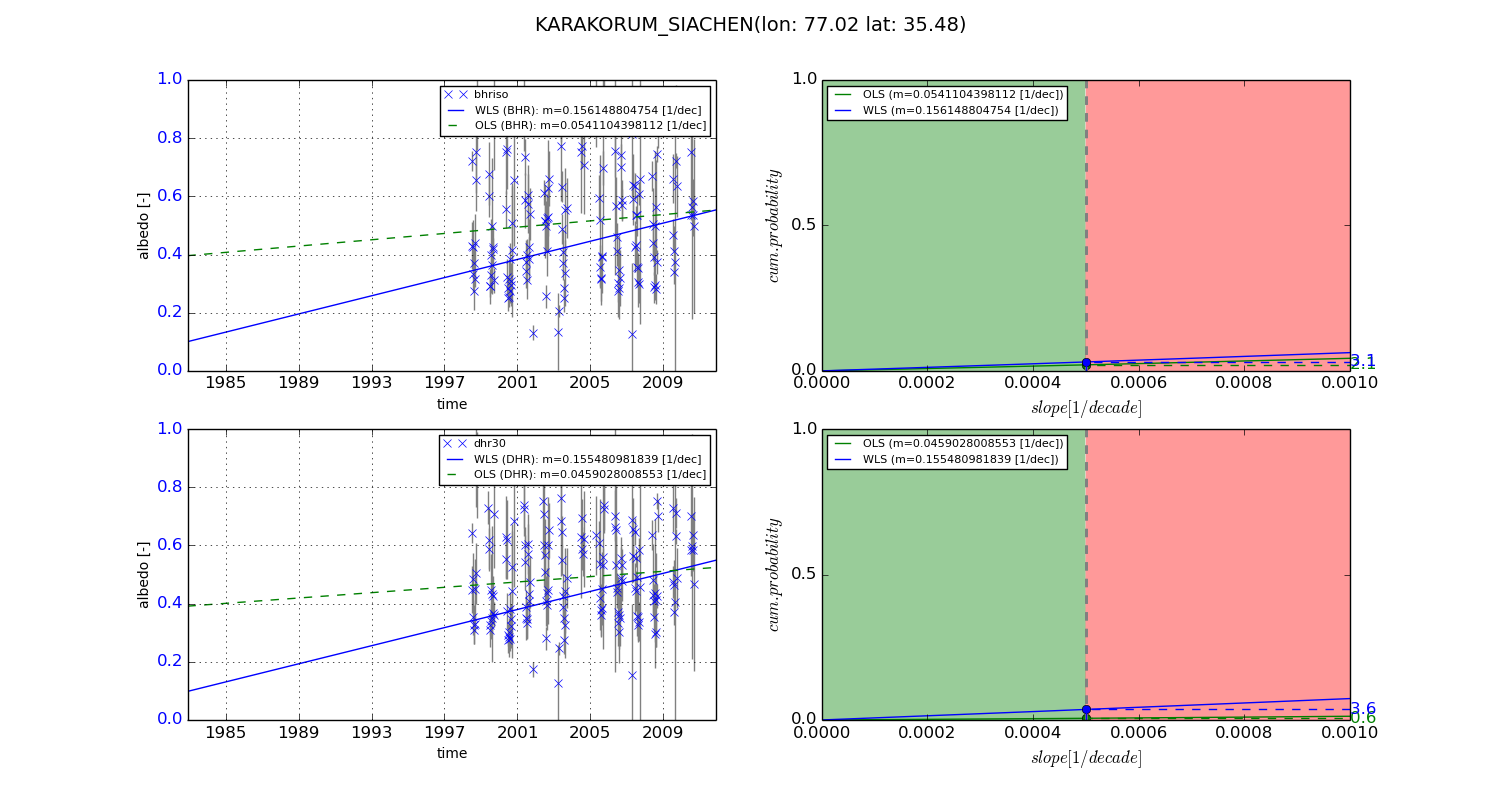
Temporal stability analysis

+000 deg (BHR)


BHR statistics

Temporal stability [1/decade]:


abs

rel


Weighted least square:

-99999.0


Ordinary least square:

-99999.0


Probabilities that GCOS criteria is met:

Weighted least square:

-99999.0 %

Ordinary least square:

-99999.0 %


DHR statistics

Temporal stability [1/decade]:


abs

rel


Weighted least square:

-99999.0


Ordinary least square:

-99999.0


Probabilities that GCOS criteria is met:

Weighted least square:

-99999.0 %

Ordinary least square:

-99999.0 %


+057/+063 deg (BHR)


BHR statistics

Temporal stability [1/decade]:


abs

rel


Weighted least square:

0.156148804754


Ordinary least square:

0.0541104398112


Probabilities that GCOS criteria is met:

Weighted least square:

3.1 %

Ordinary least square:

2.1 %


DHR statistics

Temporal stability [1/decade]:


abs

rel


Weighted least square:

0.155480981839


Ordinary least square:

0.0459028008553


Probabilities that GCOS criteria is met:

Weighted least square:

3.6 %

Ordinary least square:

0.6 %


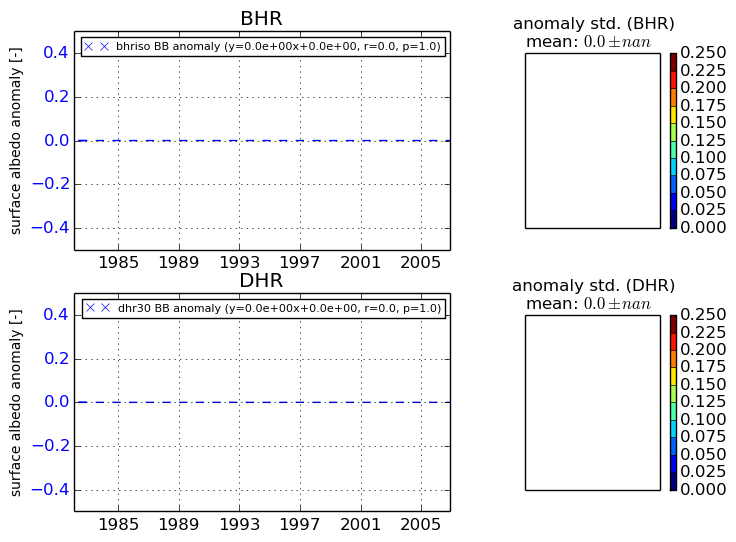
Temporal anomaly analyis

The variance of the temporal anomalies provides an additional measure about the stability of the signal AFTER removal of the mean seasonal cylce.
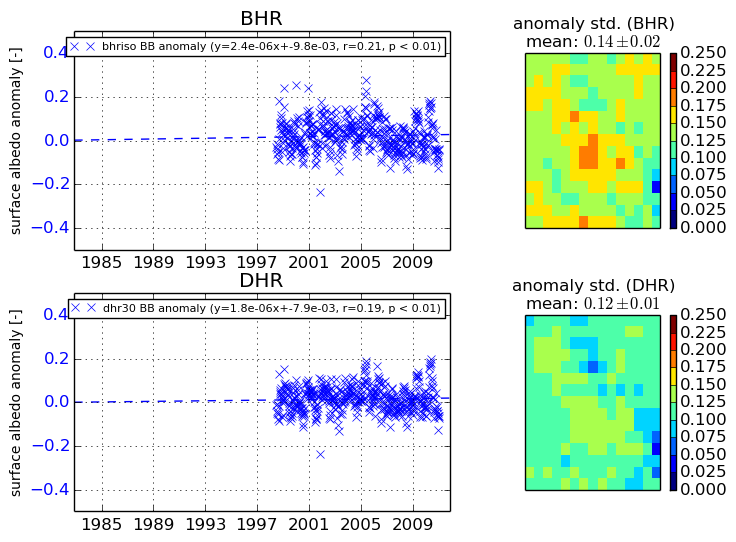
+000 deg


+057/+063 deg