KASAMA


Location

lon / lat [deg]: 31.1833 / -10.1667

Source network: AERONET


Geostationary surface albedo (GSA) data


“+000”


“+057/+063”


Landcover information (based on ESA CCI landcover data)


Landcover fractions @ 2km distance


Landcover fractions @ 20 km distance


Legend


Distance to open water bodies [km]:

31.27

Distance to urban areas [km]:

3.59


Radius: 1 km

Number of landcover classes:

1

Dominant landcover type:

10: cropland, rainfed

Fraction of dominant landcover type [%]:

100.0


Radius: 2 km

Number of landcover classes:

3

Dominant landcover type:

10: cropland, rainfed

Fraction of dominant landcover type [%]:

94.0


Radius: 5 km

Number of landcover classes:

4

Dominant landcover type:

10: cropland, rainfed

Fraction of dominant landcover type [%]:

92.0


Radius: 10 km

Number of landcover classes:

3

Dominant landcover type:

10: cropland, rainfed

Fraction of dominant landcover type [%]:

94.0


Radius: 20 km

Number of landcover classes:

3

Dominant landcover type:

10: cropland, rainfed

Fraction of dominant landcover type [%]:

92.0


Disturbances


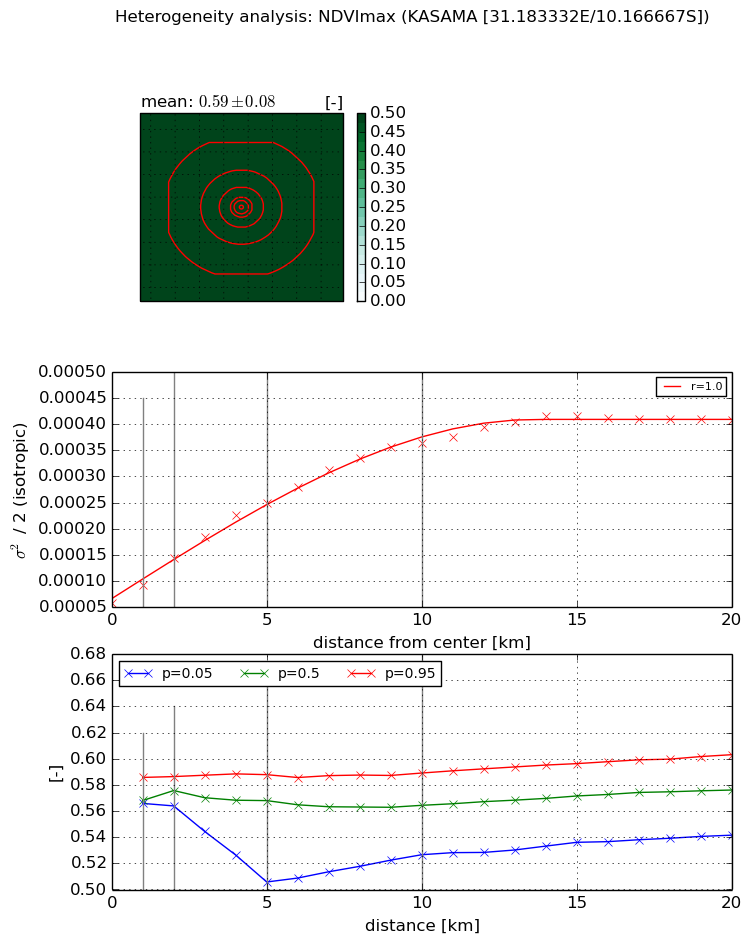
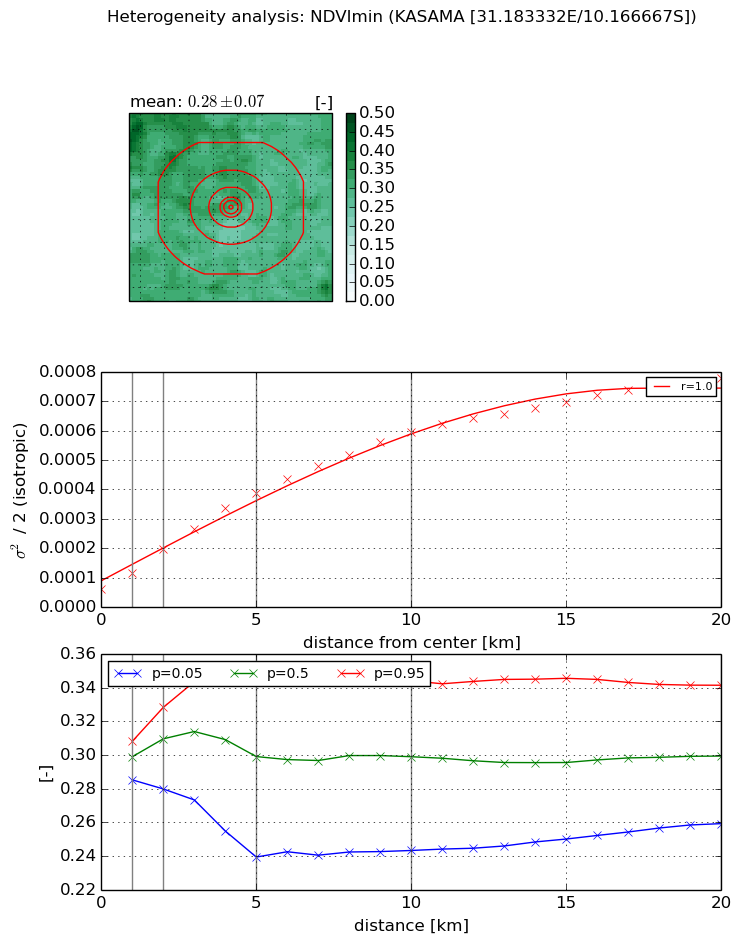
Heterogeneity analysis

The heterogeneity analysis provides information about the spatial and temporal heterogeneity of the site.

Topography


Roman et al. (2009) index


St

0.661157427422

Rcv

0.3631310499

Rse

0.0

Rst

2.94504082451e-06

Rsv

4.17436324184


Height range @ 1km [m]

14

Height range @ 2km [m]

47

Height range @ 5km [m]

80

Height range @ 10km [m]

-999

Height range @ 20km [m]

-999


Variance slope @ 1 km

79

Variance slope @ 2 km

98

Variance slope @ 5 km

134

Variance slope @ 10 km

-999

Variance slope @ 20 km

-999


NDVI (max. NDVI composite)


Roman et al. (2009) index


St

1.97140480081

Rcv

0.769669928698

Rse

0.0

Rst

-0.108772838885

Rsv

0.643314711536


NDVI range @ 1km [-]

0.02

NDVI range @ 2km [-]

0.02

NDVI range @ 5km [-]

0.08

NDVI range @ 10km [-]

0.06

NDVI range @ 20km [-]

0.06


Variance slope @ 1 km

3.41641153794e-05

Variance slope @ 2 km

4.31156749978e-05

Variance slope @ 5 km

3.99615258067e-05

Variance slope @ 10 km

3.15318951611e-05

Variance slope @ 20 km

1.68236765304e-05


NDVI (min. NDVI composite)I


Roman et al. (2009) index


St

4.96826321403

Rcv

0.32036717026

Rse

0.0

Rst

-0.258420616522

Rsv

0.0250449553176


NDVI range @ 1km [-]

0.02

NDVI range @ 2km [-]

0.05

NDVI range @ 5km [-]

0.11

NDVI range @ 10km [-]

0.1

NDVI range @ 20km [-]

0.08


NDVI slope @ 1 km

5.23700379245e-05

NDVI slope @ 2 km

6.79378535847e-05

NDVI slope @ 5 km

6.73361400003e-05

NDVI slope @ 10 km

5.38617093469e-05

NDVI slope @ 20 km

3.43175881121e-05


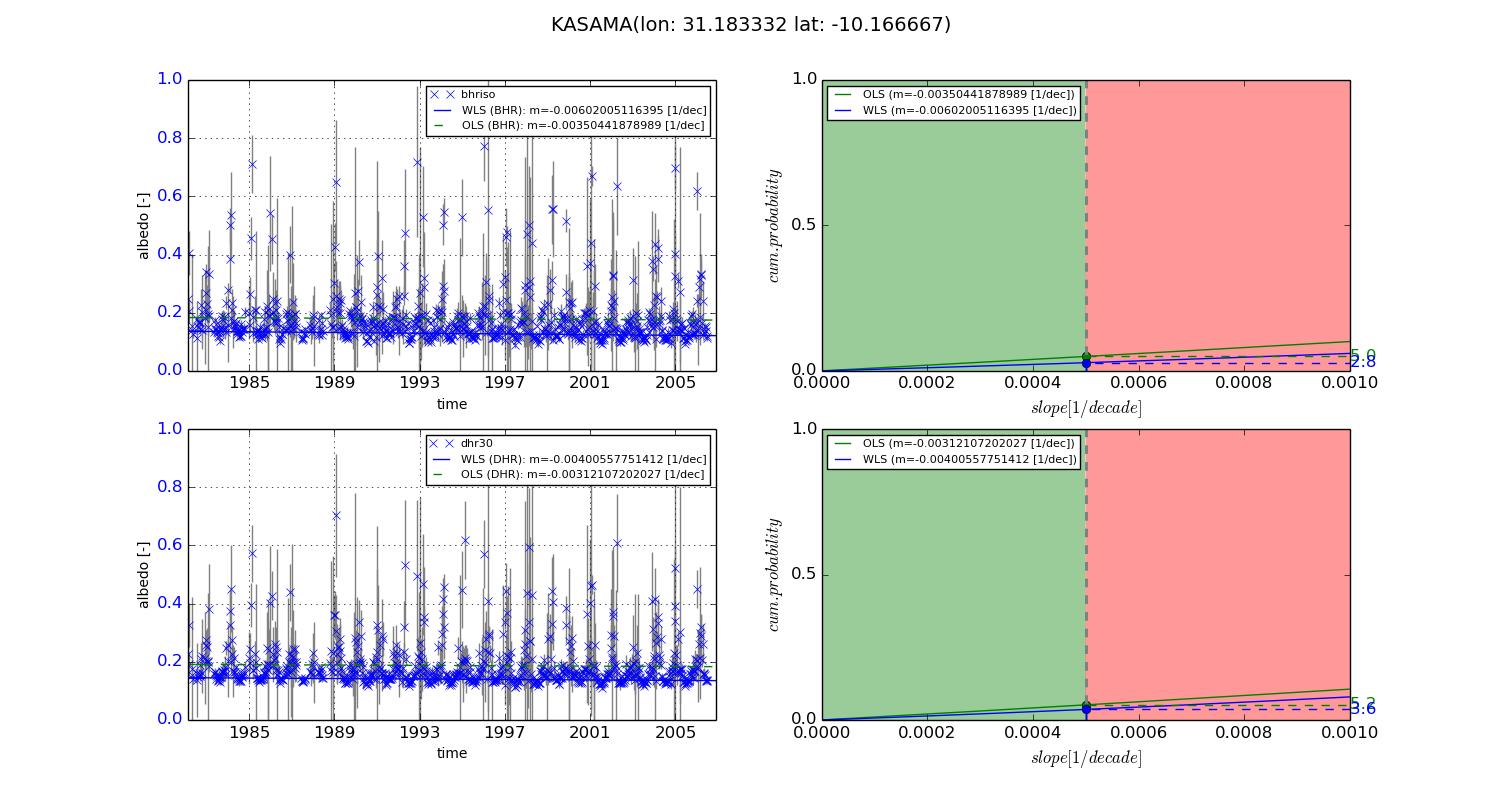
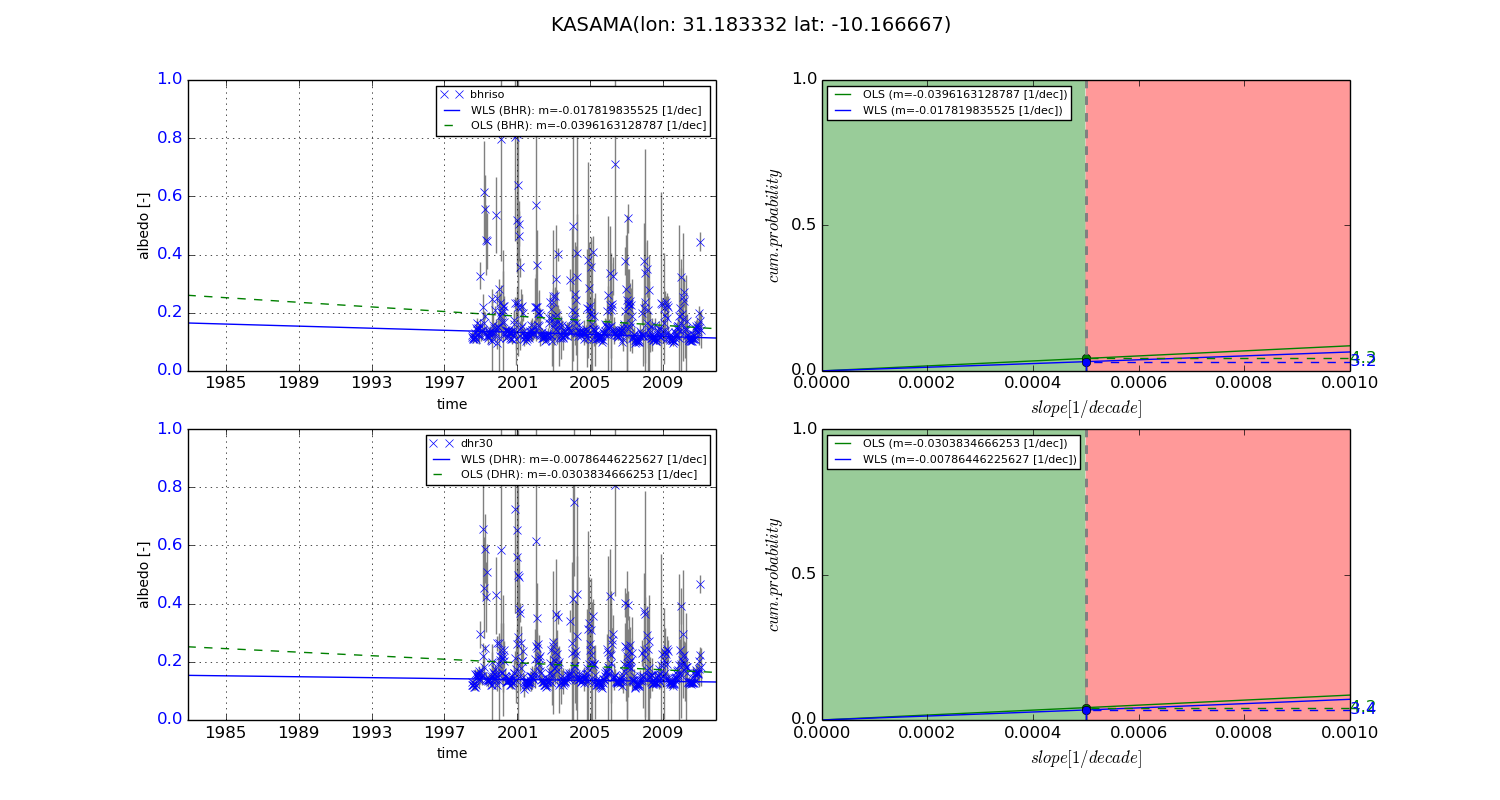
Temporal stability analysis

+000 deg (BHR)


BHR statistics

Temporal stability [1/decade]:


abs

rel


Weighted least square:

-0.00602005116395


Ordinary least square:

-0.00350441878989


Probabilities that GCOS criteria is met:

Weighted least square:

2.8 %

Ordinary least square:

5.0 %


DHR statistics

Temporal stability [1/decade]:


abs

rel


Weighted least square:

-0.00400557751412


Ordinary least square:

-0.00312107202027


Probabilities that GCOS criteria is met:

Weighted least square:

3.6 %

Ordinary least square:

5.2 %


+057/+063 deg (BHR)


BHR statistics

Temporal stability [1/decade]:


abs

rel


Weighted least square:

-0.017819835525


Ordinary least square:

-0.0396163128787


Probabilities that GCOS criteria is met:

Weighted least square:

3.2 %

Ordinary least square:

4.3 %


DHR statistics

Temporal stability [1/decade]:


abs

rel


Weighted least square:

-0.00786446225627


Ordinary least square:

-0.0303834666253


Probabilities that GCOS criteria is met:

Weighted least square:

3.4 %

Ordinary least square:

4.2 %


Temporal anomaly analyis

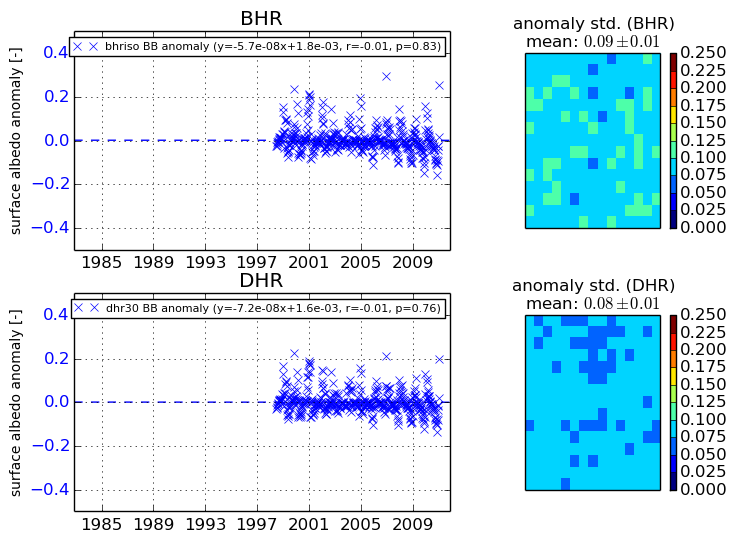
The variance of the temporal anomalies provides an additional measure about the stability of the signal AFTER removal of the mean seasonal cylce.
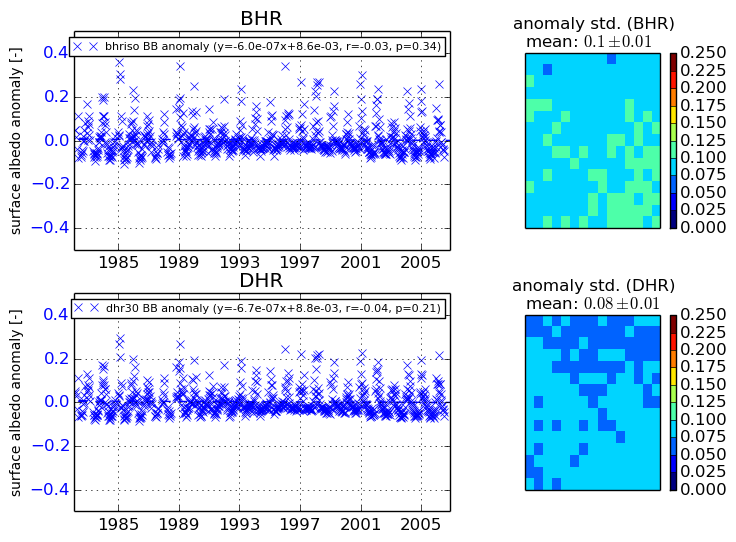
+000 deg


+057/+063 deg