KATHMANDU-BODE


Location

lon / lat [deg]: 85.39 / 27.68

Source network: AERONET


Geostationary surface albedo (GSA) data


“+000”


“+057/+063”


Landcover information (based on ESA CCI landcover data)


Landcover fractions @ 2km distance


Landcover fractions @ 20 km distance


Legend


Distance to open water bodies [km]:

24.24

Distance to urban areas [km]:

0.56


Radius: 1 km

Number of landcover classes:

5

Dominant landcover type:

40: mosaic natural vegetation (tree, shrub, herbaceous cover) (>50%) / cropland (<50%)

Fraction of dominant landcover type [%]:

36.0


Radius: 2 km

Number of landcover classes:

5

Dominant landcover type:

40: mosaic natural vegetation (tree, shrub, herbaceous cover) (>50%) / cropland (<50%)

Fraction of dominant landcover type [%]:

40.0


Radius: 5 km

Number of landcover classes:

7

Dominant landcover type:

190: urban areas

Fraction of dominant landcover type [%]:

35.0


Radius: 10 km

Number of landcover classes:

8

Dominant landcover type:

190: urban areas

Fraction of dominant landcover type [%]:

28.0


Radius: 20 km

Number of landcover classes:

10

Dominant landcover type:

40: mosaic natural vegetation (tree, shrub, herbaceous cover) (>50%) / cropland (<50%)

Fraction of dominant landcover type [%]:

22.0


Disturbances


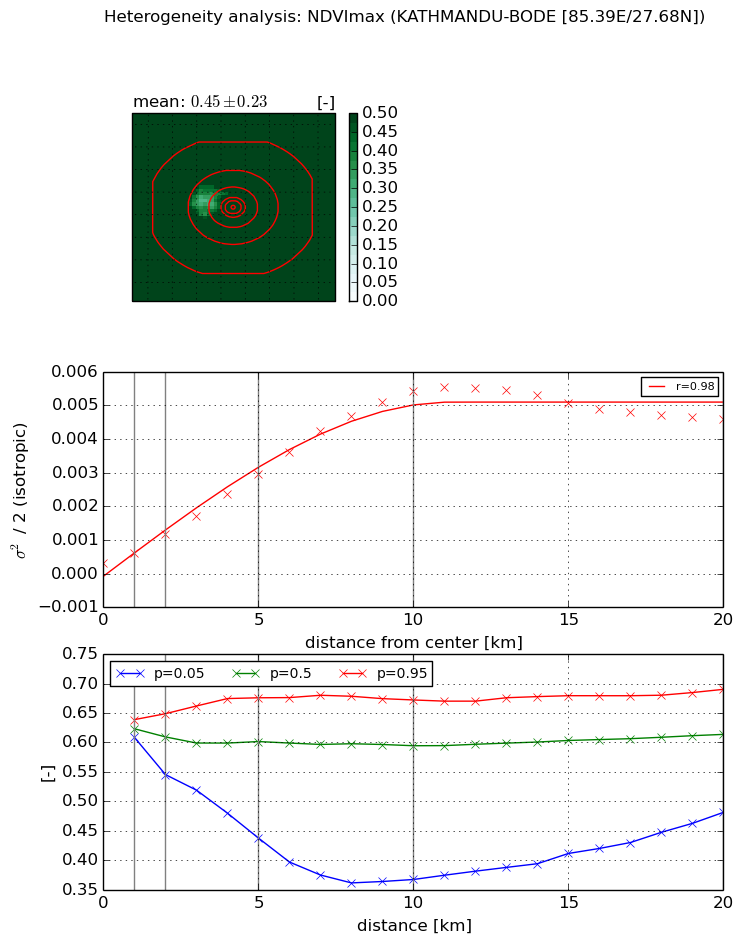
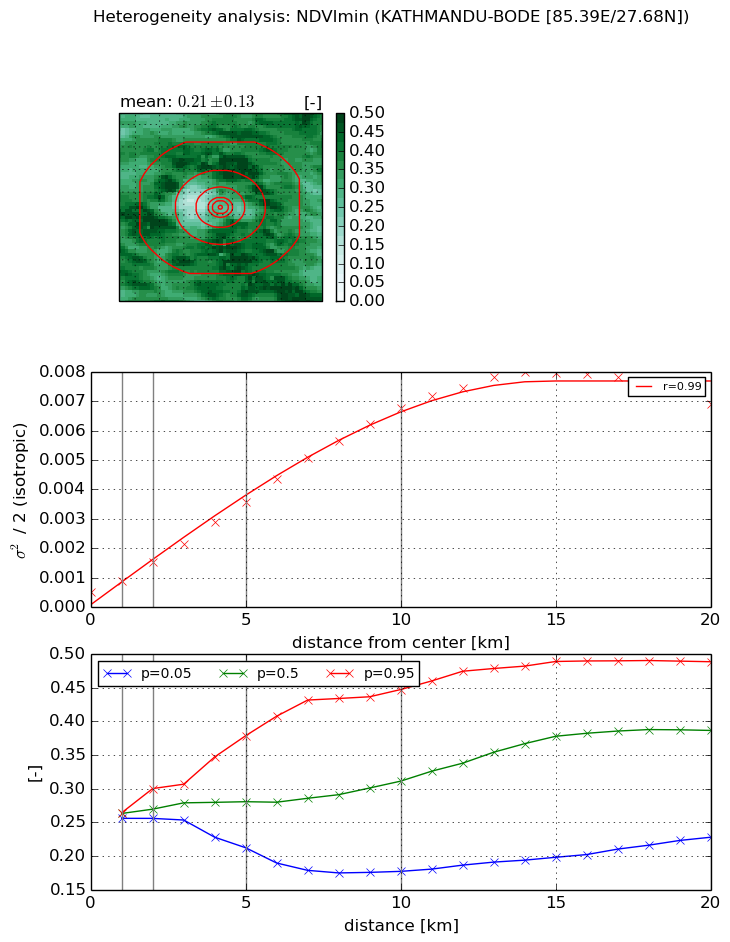
Heterogeneity analysis

The heterogeneity analysis provides information about the spatial and temporal heterogeneity of the site.

Topography


Roman et al. (2009) index


St

4.10798076425e-05

Rcv

1.02194747236

Rse

0.0

Rst

-0.0494420466656

Rsv

73027.5081528


Height range @ 1km [m]

35

Height range @ 2km [m]

44

Height range @ 5km [m]

96

Height range @ 10km [m]

-999

Height range @ 20km [m]

-999


Variance slope @ 1 km

833

Variance slope @ 2 km

658

Variance slope @ 5 km

542

Variance slope @ 10 km

-999

Variance slope @ 20 km

-999


NDVI (max. NDVI composite)


Roman et al. (2009) index


St

2.79511547077

Rcv

0.597496800198

Rse

0.0

Rst

-2.6881268257e-07

Rsv

-0.47580384874


NDVI range @ 1km [-]

0.03

NDVI range @ 2km [-]

0.1

NDVI range @ 5km [-]

0.24

NDVI range @ 10km [-]

0.31

NDVI range @ 20km [-]

0.21


Variance slope @ 1 km

0.000279468915922

Variance slope @ 2 km

0.000421735608095

Variance slope @ 5 km

0.000545832791577

Variance slope @ 10 km

0.000548556471919

Variance slope @ 20 km

0.000217433998969


NDVI (min. NDVI composite)I


Roman et al. (2009) index


St

0.939904840112

Rcv

1.63134202757

Rse

0.0

Rst

-0.560470638256

Rsv

-0.999999815578


NDVI range @ 1km [-]

0.01

NDVI range @ 2km [-]

0.04

NDVI range @ 5km [-]

0.17

NDVI range @ 10km [-]

0.27

NDVI range @ 20km [-]

0.26


NDVI slope @ 1 km

0.000368316869401

NDVI slope @ 2 km

0.000517797293089

NDVI slope @ 5 km

0.000629435697388

NDVI slope @ 10 km

0.000655874714714

NDVI slope @ 20 km

0.000375512681589


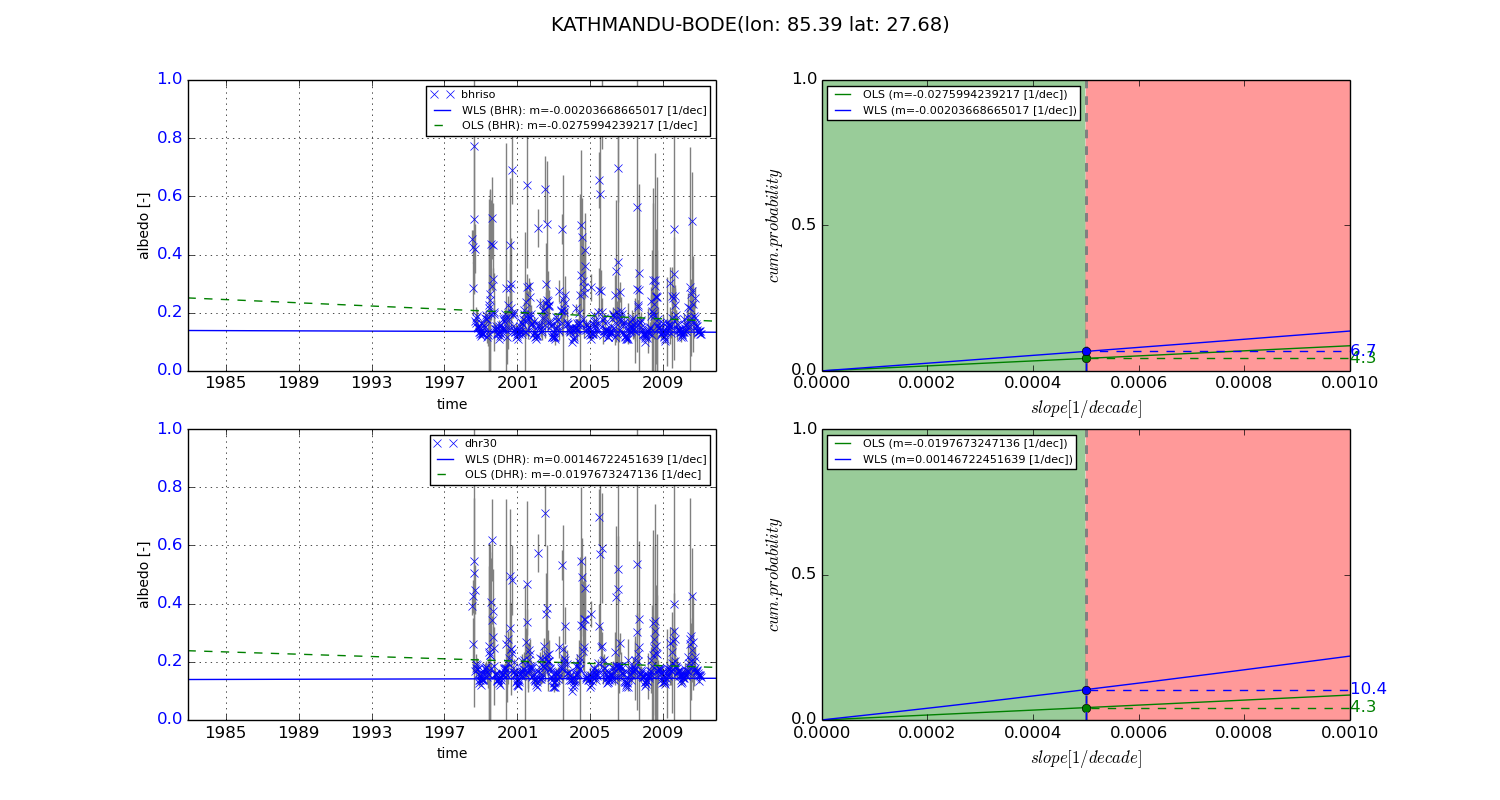
Temporal stability analysis

+000 deg (BHR)


BHR statistics

Temporal stability [1/decade]:


abs

rel


Weighted least square:

None


Ordinary least square:

None


Probabilities that GCOS criteria is met:

Weighted least square:

None %

Ordinary least square:

None %


DHR statistics

Temporal stability [1/decade]:


abs

rel


Weighted least square:

None


Ordinary least square:

None


Probabilities that GCOS criteria is met:

Weighted least square:

None %

Ordinary least square:

None %


+057/+063 deg (BHR)


BHR statistics

Temporal stability [1/decade]:


abs

rel


Weighted least square:

-0.00203668665017


Ordinary least square:

-0.0275994239217


Probabilities that GCOS criteria is met:

Weighted least square:

6.7 %

Ordinary least square:

4.3 %


DHR statistics

Temporal stability [1/decade]:


abs

rel


Weighted least square:

0.00146722451639


Ordinary least square:

-0.0197673247136


Probabilities that GCOS criteria is met:

Weighted least square:

10.4 %

Ordinary least square:

4.3 %


Temporal anomaly analyis

The variance of the temporal anomalies provides an additional measure about the stability of the signal AFTER removal of the mean seasonal cylce.

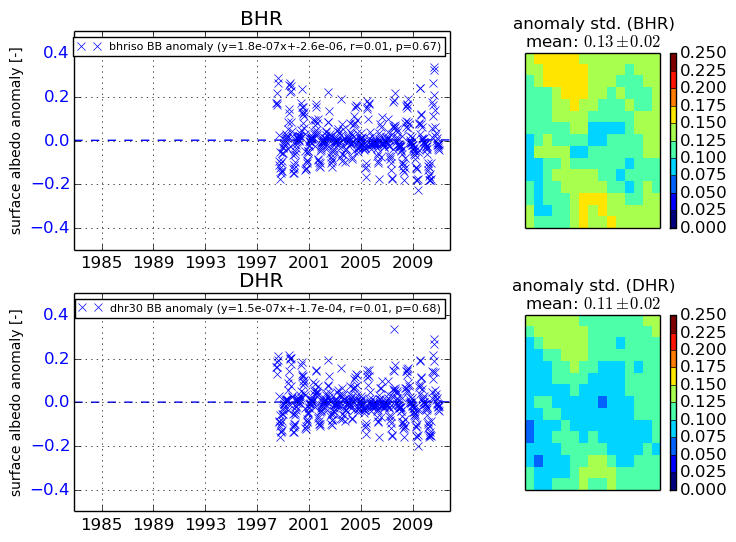
+000 deg


+057/+063 deg