KATHMANDU_UNIV


Location

lon / lat [deg]: 85.5383 / 27.6011

Source network: AERONET


Geostationary surface albedo (GSA) data


“+000”


“+057/+063”


Landcover information (based on ESA CCI landcover data)


Landcover fractions @ 2km distance


Landcover fractions @ 20 km distance


Legend


Distance to open water bodies [km]:

37.14

Distance to urban areas [km]:

3.74


Radius: 1 km

Number of landcover classes:

5

Dominant landcover type:

60: Tree cover, broadleaved, decidous

Fraction of dominant landcover type [%]:

34.0


Radius: 2 km

Number of landcover classes:

7

Dominant landcover type:

40: mosaic natural vegetation (tree, shrub, herbaceous cover) (>50%) / cropland (<50%)

Fraction of dominant landcover type [%]:

34.0


Radius: 5 km

Number of landcover classes:

8

Dominant landcover type:

40: mosaic natural vegetation (tree, shrub, herbaceous cover) (>50%) / cropland (<50%)

Fraction of dominant landcover type [%]:

31.0


Radius: 10 km

Number of landcover classes:

8

Dominant landcover type:

40: mosaic natural vegetation (tree, shrub, herbaceous cover) (>50%) / cropland (<50%)

Fraction of dominant landcover type [%]:

29.0


Radius: 20 km

Number of landcover classes:

9

Dominant landcover type:

40: mosaic natural vegetation (tree, shrub, herbaceous cover) (>50%) / cropland (<50%)

Fraction of dominant landcover type [%]:

23.0


Disturbances


Heterogeneity analysis

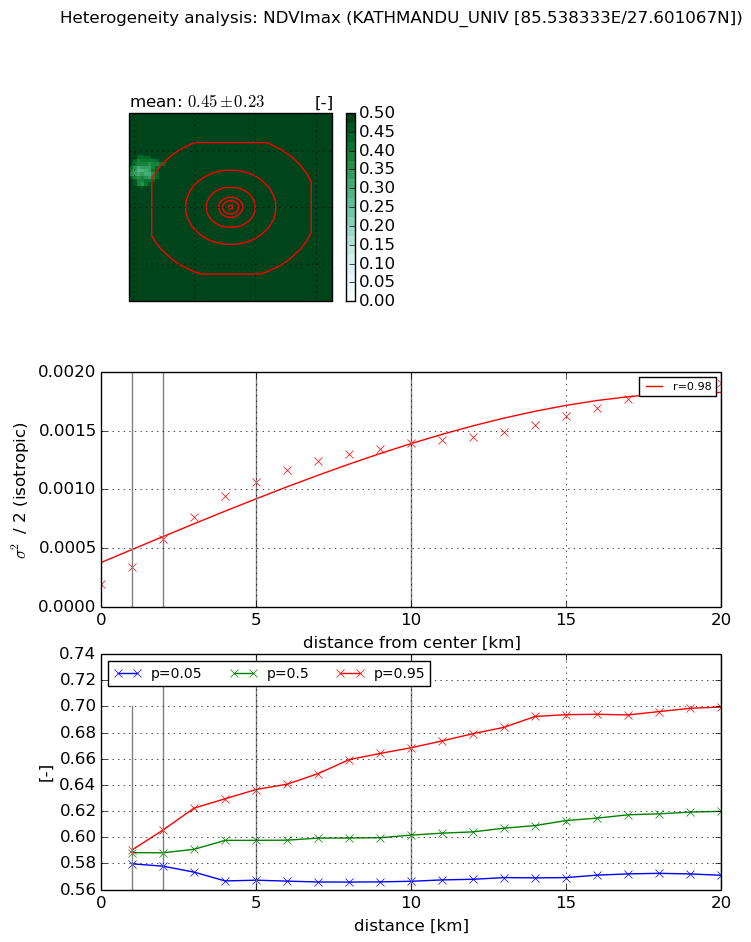
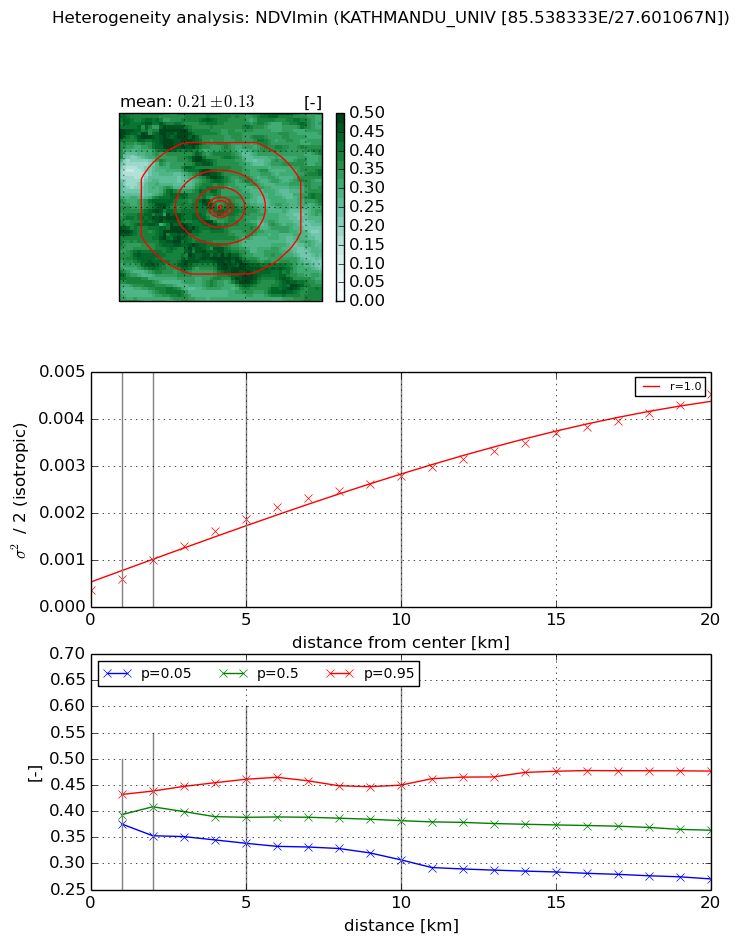
The heterogeneity analysis provides information about the spatial and temporal heterogeneity of the site.

Topography


Roman et al. (2009) index


St

2.58608142404

Rcv

0.711442984965

Rse

0.0

Rst

-0.0485791147612

Rsv

0.400034181609


Height range @ 1km [m]

220

Height range @ 2km [m]

206

Height range @ 5km [m]

452

Height range @ 10km [m]

-999

Height range @ 20km [m]

-999


Variance slope @ 1 km

7038

Variance slope @ 2 km

7376

Variance slope @ 5 km

3721

Variance slope @ 10 km

-999

Variance slope @ 20 km

-999


NDVI (max. NDVI composite)


Roman et al. (2009) index


St

2.8631936684e-10

Rcv

0.212574008706

Rse

0.0

Rst

0.342525750845

Rsv

10477810261.2


NDVI range @ 1km [-]

0.01

NDVI range @ 2km [-]

0.03

NDVI range @ 5km [-]

0.07

NDVI range @ 10km [-]

0.1

NDVI range @ 20km [-]

0.13


Variance slope @ 1 km

0.000140513517581

Variance slope @ 2 km

0.000191578255962

Variance slope @ 5 km

0.000181312672988

Variance slope @ 10 km

0.000121427434232

Variance slope @ 20 km

7.55578640099e-05


NDVI (min. NDVI composite)I


Roman et al. (2009) index


St

1.62564339757

Rcv

0.216750799038

Rse

0.0

Rst

-0.628673036603

Rsv

-0.999999339257


NDVI range @ 1km [-]

0.06

NDVI range @ 2km [-]

0.09

NDVI range @ 5km [-]

0.12

NDVI range @ 10km [-]

0.14

NDVI range @ 20km [-]

0.21


NDVI slope @ 1 km

0.000237441967752

NDVI slope @ 2 km

0.000314383954861

NDVI slope @ 5 km

0.000311725507295

NDVI slope @ 10 km

0.000247135996934

NDVI slope @ 20 km

0.00019623865283


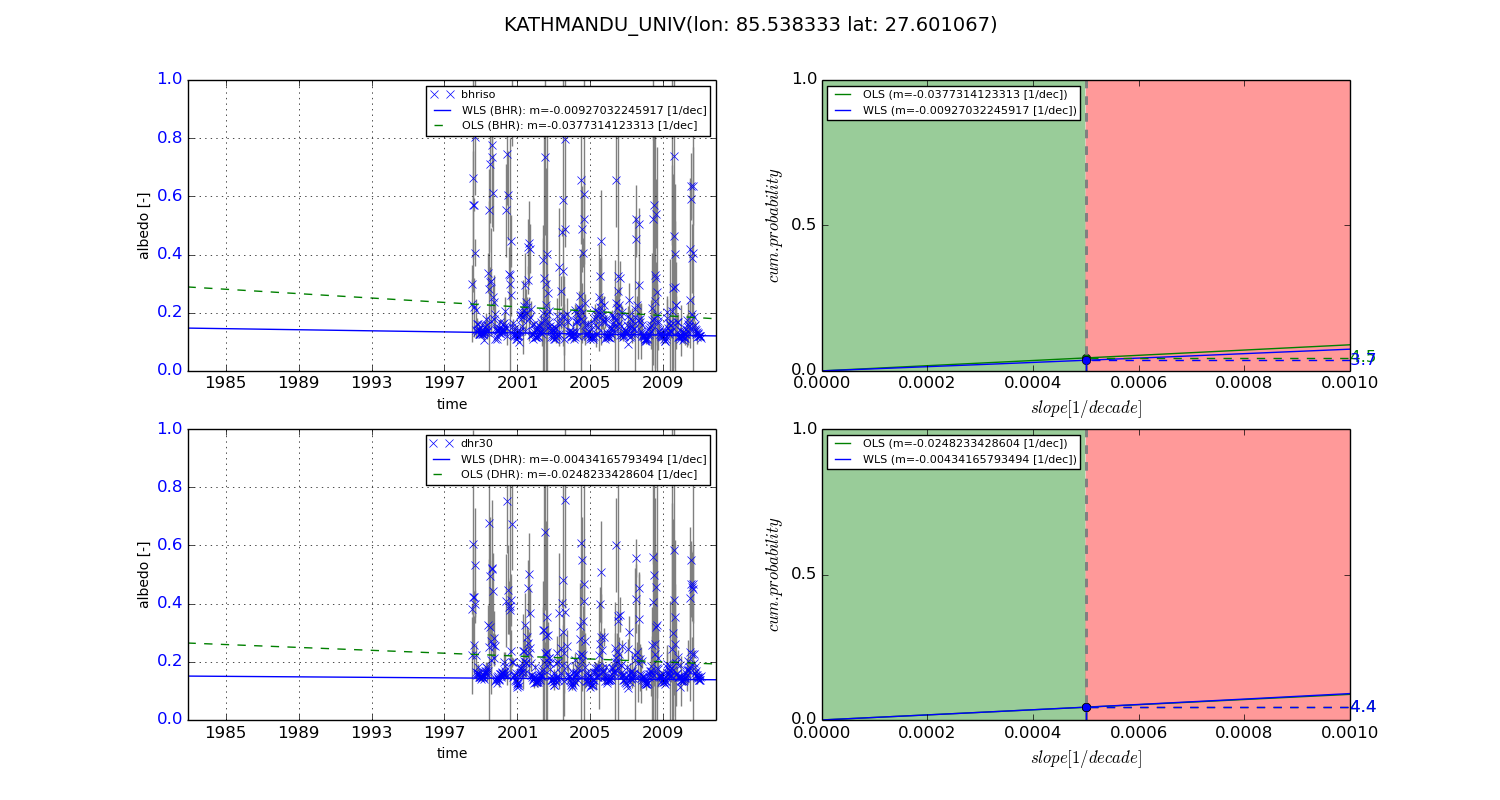
Temporal stability analysis

+000 deg (BHR)


BHR statistics

Temporal stability [1/decade]:


abs

rel


Weighted least square:

None


Ordinary least square:

None


Probabilities that GCOS criteria is met:

Weighted least square:

None %

Ordinary least square:

None %


DHR statistics

Temporal stability [1/decade]:


abs

rel


Weighted least square:

None


Ordinary least square:

None


Probabilities that GCOS criteria is met:

Weighted least square:

None %

Ordinary least square:

None %


+057/+063 deg (BHR)


BHR statistics

Temporal stability [1/decade]:


abs

rel


Weighted least square:

-0.00927032245917


Ordinary least square:

-0.0377314123313


Probabilities that GCOS criteria is met:

Weighted least square:

3.7 %

Ordinary least square:

4.5 %


DHR statistics

Temporal stability [1/decade]:


abs

rel


Weighted least square:

-0.00434165793494


Ordinary least square:

-0.0248233428604


Probabilities that GCOS criteria is met:

Weighted least square:

4.4 %

Ordinary least square:

4.4 %


Temporal anomaly analyis

The variance of the temporal anomalies provides an additional measure about the stability of the signal AFTER removal of the mean seasonal cylce.

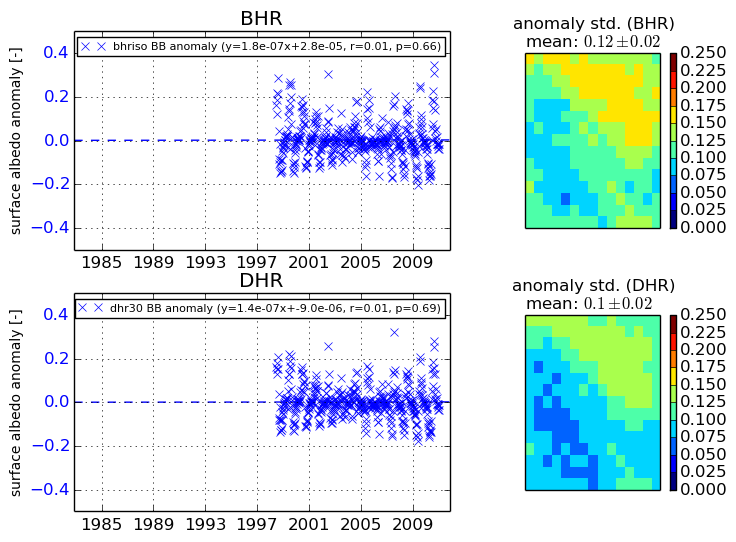
+000 deg


+057/+063 deg