KEJIMKUJIK


Location

lon / lat [deg]: -65.2833 / 44.3833

Source network: AERONET


Geostationary surface albedo (GSA) data


“+000”


“+057/+063”


Landcover information (based on ESA CCI landcover data)


Landcover fractions @ 2km distance


Landcover fractions @ 20 km distance


Legend


Distance to open water bodies [km]:

0.19

Distance to urban areas [km]:

40.39


Radius: 1 km

Number of landcover classes:

3

Dominant landcover type:

210: water bodies

Fraction of dominant landcover type [%]:

45.0


Radius: 2 km

Number of landcover classes:

5

Dominant landcover type:

210: water bodies

Fraction of dominant landcover type [%]:

45.0


Radius: 5 km

Number of landcover classes:

5

Dominant landcover type:

81: Tree cover, needleleaved, deciduous, closed (>40%)

Fraction of dominant landcover type [%]:

31.0


Radius: 10 km

Number of landcover classes:

6

Dominant landcover type:

81: Tree cover, needleleaved, deciduous, closed (>40%)

Fraction of dominant landcover type [%]:

41.0


Radius: 20 km

Number of landcover classes:

6

Dominant landcover type:

81: Tree cover, needleleaved, deciduous, closed (>40%)

Fraction of dominant landcover type [%]:

36.0


Disturbances


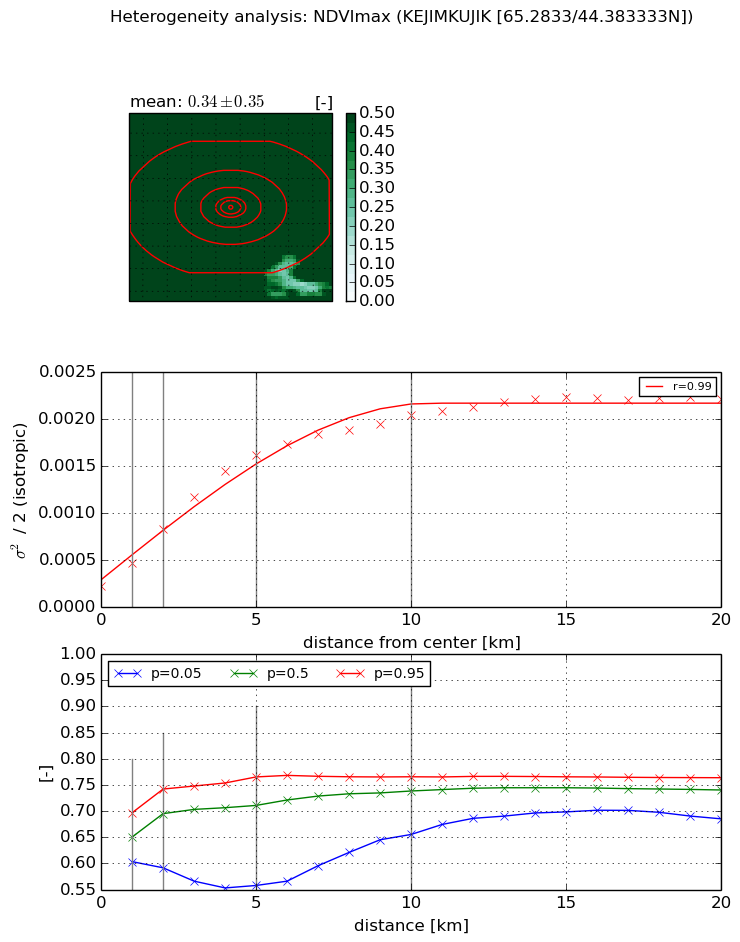
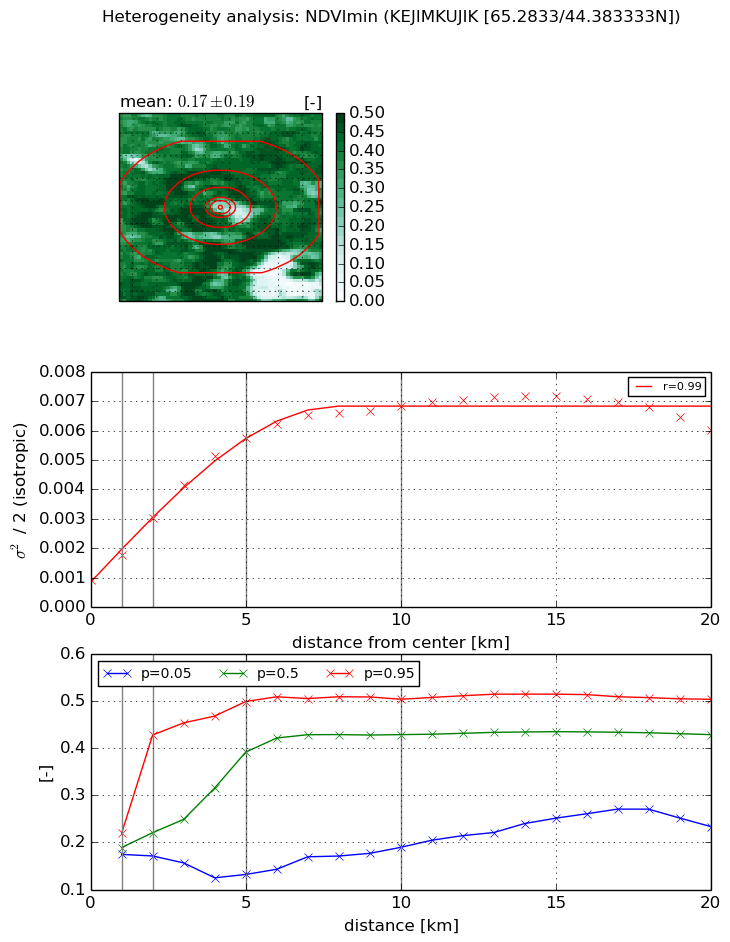
Heterogeneity analysis

The heterogeneity analysis provides information about the spatial and temporal heterogeneity of the site.

Topography


Roman et al. (2009) index


St

6.74474834863e-05

Rcv

1.72694127434

Rse

0.0

Rst

0.0102183709138

Rsv

44477.3129833


Height range @ 1km [m]

0

Height range @ 2km [m]

0

Height range @ 5km [m]

64

Height range @ 10km [m]

-999

Height range @ 20km [m]

-999


Variance slope @ 1 km

74

Variance slope @ 2 km

86

Variance slope @ 5 km

94

Variance slope @ 10 km

-999

Variance slope @ 20 km

-999


NDVI (max. NDVI composite)


Roman et al. (2009) index


St

3.08830135118

Rcv

0.226322550169

Rse

0.0

Rst

-0.128799761047

Rsv

0.616285481891


NDVI range @ 1km [-]

0.09

NDVI range @ 2km [-]

0.15

NDVI range @ 5km [-]

0.21

NDVI range @ 10km [-]

0.11

NDVI range @ 20km [-]

0.08


Variance slope @ 1 km

0.00024001482704

Variance slope @ 2 km

0.000301045355938

Variance slope @ 5 km

0.000291553302482

Variance slope @ 10 km

0.000180130585501

Variance slope @ 20 km

8.49529594333e-05


NDVI (min. NDVI composite)I


Roman et al. (2009) index


St

10.0074998485

Rcv

-0.00305010281113

Rse

0.0

Rst

-0.0156724474637

Rsv

0.281052622888


NDVI range @ 1km [-]

0.05

NDVI range @ 2km [-]

0.26

NDVI range @ 5km [-]

0.37

NDVI range @ 10km [-]

0.31

NDVI range @ 20km [-]

0.27


NDVI slope @ 1 km

0.000866413982304

NDVI slope @ 2 km

0.00105525459248

NDVI slope @ 5 km

0.00100790020064

NDVI slope @ 10 km

0.000597837135485

NDVI slope @ 20 km

0.000218959899865


Temporal stability analysis

+000 deg (BHR)


BHR statistics

Temporal stability [1/decade]:


abs

rel


Weighted least square:

-99999.0


Ordinary least square:

-99999.0


Probabilities that GCOS criteria is met:

Weighted least square:

-99999.0 %

Ordinary least square:

-99999.0 %


DHR statistics

Temporal stability [1/decade]:


abs

rel


Weighted least square:

-99999.0


Ordinary least square:

-99999.0


Probabilities that GCOS criteria is met:

Weighted least square:

-99999.0 %

Ordinary least square:

-99999.0 %


+057/+063 deg (BHR)


BHR statistics

Temporal stability [1/decade]:


abs

rel


Weighted least square:

None


Ordinary least square:

None


Probabilities that GCOS criteria is met:

Weighted least square:

None %

Ordinary least square:

None %


DHR statistics

Temporal stability [1/decade]:


abs

rel


Weighted least square:

None


Ordinary least square:

None


Probabilities that GCOS criteria is met:

Weighted least square:

None %

Ordinary least square:

None %


Temporal anomaly analyis

The variance of the temporal anomalies provides an additional measure about the stability of the signal AFTER removal of the mean seasonal cylce.

+000 deg


+057/+063 deg