KELLOGG_LTER


Location

lon / lat [deg]: -85.3717 / 42.408

Source network: AERONET


Geostationary surface albedo (GSA) data


“+000”


“+057/+063”


Landcover information (based on ESA CCI landcover data)


Landcover fractions @ 2km distance


Landcover fractions @ 20 km distance


Legend


Distance to open water bodies [km]:

0.86

Distance to urban areas [km]:

2.11


Radius: 1 km

Number of landcover classes:

5

Dominant landcover type:

10: cropland, rainfed

Fraction of dominant landcover type [%]:

55.0


Radius: 2 km

Number of landcover classes:

8

Dominant landcover type:

10: cropland, rainfed

Fraction of dominant landcover type [%]:

53.0


Radius: 5 km

Number of landcover classes:

9

Dominant landcover type:

10: cropland, rainfed

Fraction of dominant landcover type [%]:

43.0


Radius: 10 km

Number of landcover classes:

9

Dominant landcover type:

10: cropland, rainfed

Fraction of dominant landcover type [%]:

47.0


Radius: 20 km

Number of landcover classes:

9

Dominant landcover type:

10: cropland, rainfed

Fraction of dominant landcover type [%]:

40.0


Disturbances


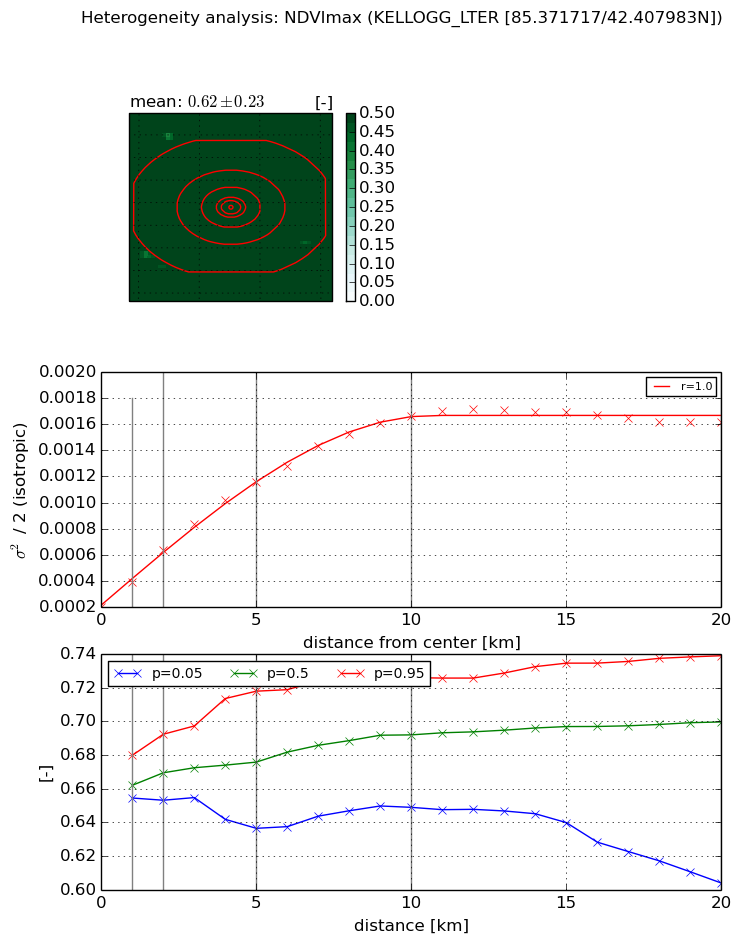
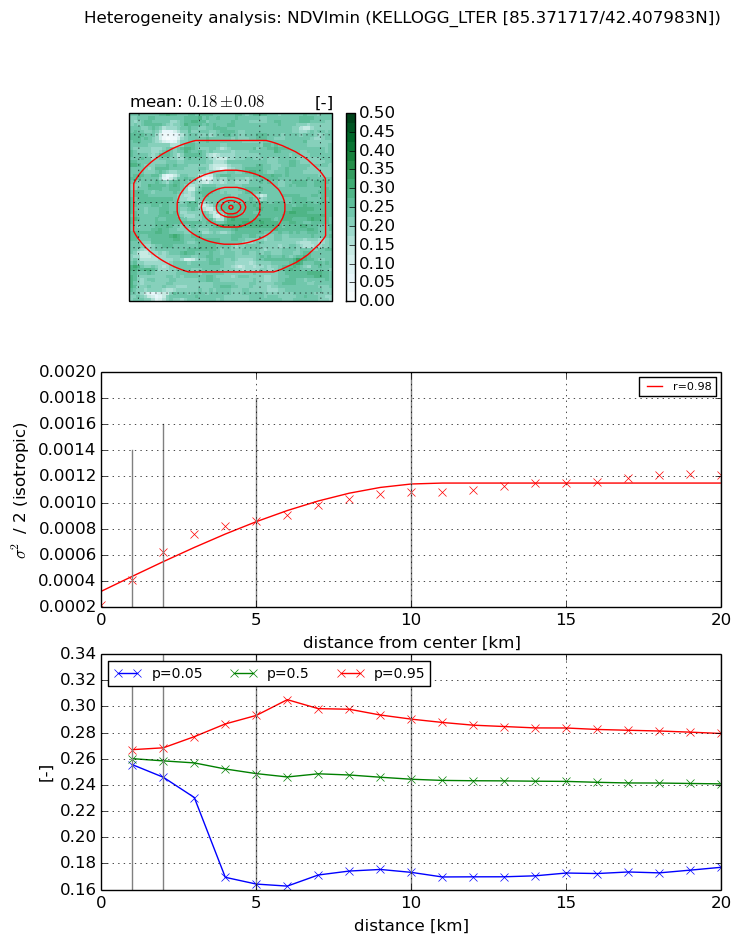
Heterogeneity analysis

The heterogeneity analysis provides information about the spatial and temporal heterogeneity of the site.

Topography


Roman et al. (2009) index


St

6.33693411419

Rcv

0.0520522048945

Rse

0.0

Rst

-0.0360257932627

Rsv

-0.385337054917


Height range @ 1km [m]

15

Height range @ 2km [m]

25

Height range @ 5km [m]

30

Height range @ 10km [m]

-999

Height range @ 20km [m]

-999


Variance slope @ 1 km

50

Variance slope @ 2 km

32

Variance slope @ 5 km

13

Variance slope @ 10 km

-999

Variance slope @ 20 km

-999


NDVI (max. NDVI composite)


Roman et al. (2009) index


St

1.18383223363

Rcv

0.799670008435

Rse

0.0

Rst

-0.190872056846

Rsv

1.54360079279


NDVI range @ 1km [-]

0.03

NDVI range @ 2km [-]

0.04

NDVI range @ 5km [-]

0.08

NDVI range @ 10km [-]

0.08

NDVI range @ 20km [-]

0.14


Variance slope @ 1 km

0.000188637446858

Variance slope @ 2 km

0.000216339337542

Variance slope @ 5 km

0.000196061604505

Variance slope @ 10 km

0.000148083170208

Variance slope @ 20 km

6.24444105345e-05


NDVI (min. NDVI composite)I


Roman et al. (2009) index


St

1.17258141862

Rcv

1.72359551841

Rse

0.0

Rst

-0.169190362126

Rsv

0.665671854131


NDVI range @ 1km [-]

0.01

NDVI range @ 2km [-]

0.02

NDVI range @ 5km [-]

0.13

NDVI range @ 10km [-]

0.12

NDVI range @ 20km [-]

0.1


NDVI slope @ 1 km

0.00018995655161

NDVI slope @ 2 km

0.000202789836212

NDVI slope @ 5 km

0.000130835039541

NDVI slope @ 10 km

7.91738755072e-05

NDVI slope @ 20 km

3.88526431323e-05


Temporal stability analysis

+000 deg (BHR)


BHR statistics

Temporal stability [1/decade]:


abs

rel


Weighted least square:

None


Ordinary least square:

None


Probabilities that GCOS criteria is met:

Weighted least square:

None %

Ordinary least square:

None %


DHR statistics

Temporal stability [1/decade]:


abs

rel


Weighted least square:

None


Ordinary least square:

None


Probabilities that GCOS criteria is met:

Weighted least square:

None %

Ordinary least square:

None %


+057/+063 deg (BHR)


BHR statistics

Temporal stability [1/decade]:


abs

rel


Weighted least square:

None


Ordinary least square:

None


Probabilities that GCOS criteria is met:

Weighted least square:

None %

Ordinary least square:

None %


DHR statistics

Temporal stability [1/decade]:


abs

rel


Weighted least square:

None


Ordinary least square:

None


Probabilities that GCOS criteria is met:

Weighted least square:

None %

Ordinary least square:

None %


Temporal anomaly analyis

The variance of the temporal anomalies provides an additional measure about the stability of the signal AFTER removal of the mean seasonal cylce.

+000 deg


+057/+063 deg