KIRTLAND_AFB


Location

lon / lat [deg]: -106.5074 / 34.9508

Source network: AERONET


Geostationary surface albedo (GSA) data


“+000”


“+057/+063”


Landcover information (based on ESA CCI landcover data)


Landcover fractions @ 2km distance


Landcover fractions @ 20 km distance


Legend


Distance to open water bodies [km]:

15.69

Distance to urban areas [km]:

1.32


Radius: 1 km

Number of landcover classes:

2

Dominant landcover type:

130: grassland

Fraction of dominant landcover type [%]:

90.0


Radius: 2 km

Number of landcover classes:

2

Dominant landcover type:

130: grassland

Fraction of dominant landcover type [%]:

93.0


Radius: 5 km

Number of landcover classes:

2

Dominant landcover type:

130: grassland

Fraction of dominant landcover type [%]:

73.0


Radius: 10 km

Number of landcover classes:

3

Dominant landcover type:

130: grassland

Fraction of dominant landcover type [%]:

64.0


Radius: 20 km

Number of landcover classes:

5

Dominant landcover type:

130: grassland

Fraction of dominant landcover type [%]:

32.0


Disturbances


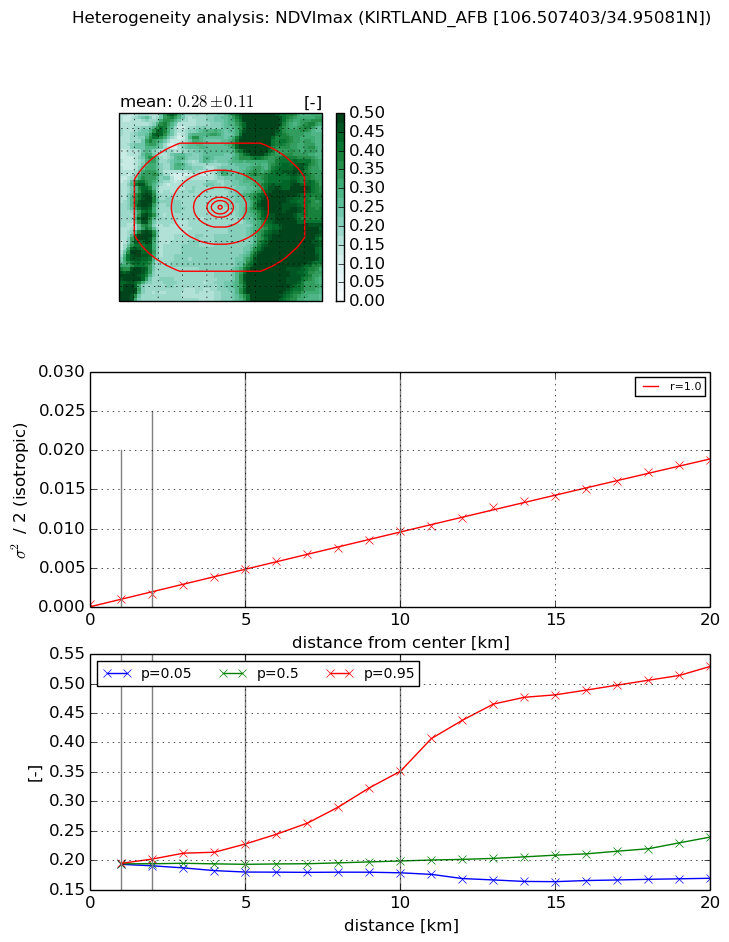
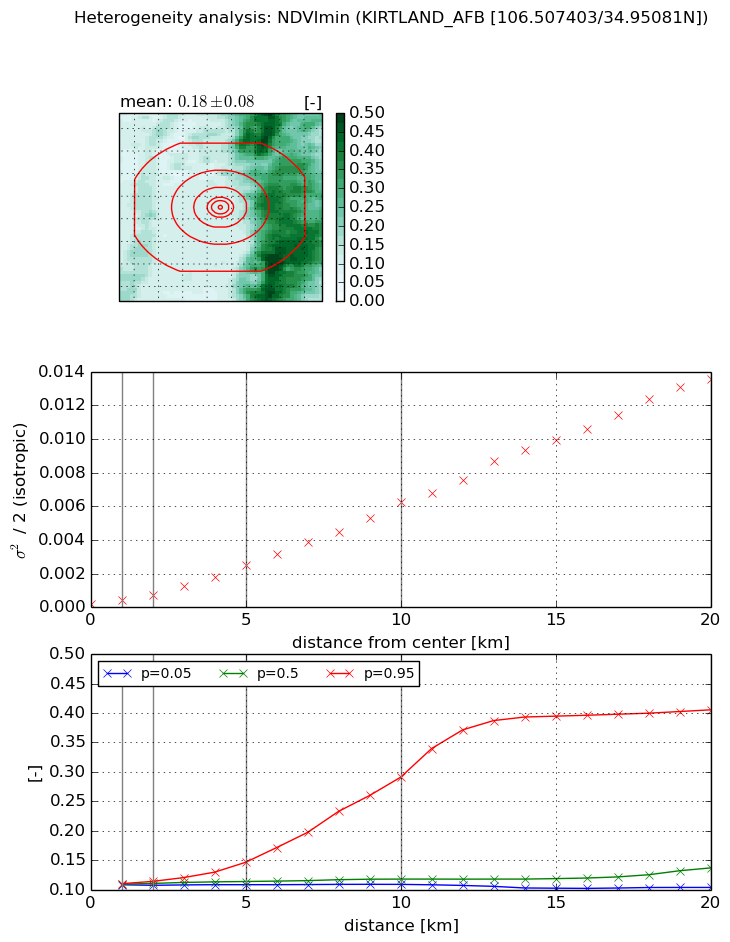
Heterogeneity analysis

The heterogeneity analysis provides information about the spatial and temporal heterogeneity of the site.

Topography


Roman et al. (2009) index


St

1.72728117559e-12

Rcv

0.73021982372

Rse

0.0

Rst

7.63868306164e-07

Rsv

1.73683361018e+12


Height range @ 1km [m]

38

Height range @ 2km [m]

74

Height range @ 5km [m]

188

Height range @ 10km [m]

-999

Height range @ 20km [m]

-999


Variance slope @ 1 km

382

Variance slope @ 2 km

460

Variance slope @ 5 km

779

Variance slope @ 10 km

-999

Variance slope @ 20 km

-999


NDVI (max. NDVI composite)


Roman et al. (2009) index


St

1.54569211419e-08

Rcv

0.953166240114

Rse

0.0

Rst

0.170941030778

Rsv

194087810.572


NDVI range @ 1km [-]

0.0

NDVI range @ 2km [-]

0.01

NDVI range @ 5km [-]

0.05

NDVI range @ 10km [-]

0.17

NDVI range @ 20km [-]

0.36


Variance slope @ 1 km

0.000619988831263

Variance slope @ 2 km

0.00066536147878

Variance slope @ 5 km

0.000920793259458

Variance slope @ 10 km

0.000949534018725

Variance slope @ 20 km

0.00094335356265


NDVI (min. NDVI composite)I


Roman et al. (2009) index


St

0.674661173009

Rcv

1.58847849099

Rse

0.0

Rst

0.147589000868

Rsv

2.71060903263


NDVI range @ 1km [-]

0.0

NDVI range @ 2km [-]

0.01

NDVI range @ 5km [-]

0.04

NDVI range @ 10km [-]

0.18

NDVI range @ 20km [-]

0.3


NDVI slope @ 1 km

0.000260019269783

NDVI slope @ 2 km

0.000287417462162

NDVI slope @ 5 km

0.00046545905459

NDVI slope @ 10 km

0.000616656834084

NDVI slope @ 20 km

0.000712954840976


Temporal stability analysis

+000 deg (BHR)


BHR statistics

Temporal stability [1/decade]:


abs

rel


Weighted least square:

None


Ordinary least square:

None


Probabilities that GCOS criteria is met:

Weighted least square:

None %

Ordinary least square:

None %


DHR statistics

Temporal stability [1/decade]:


abs

rel


Weighted least square:

None


Ordinary least square:

None


Probabilities that GCOS criteria is met:

Weighted least square:

None %

Ordinary least square:

None %


+057/+063 deg (BHR)


BHR statistics

Temporal stability [1/decade]:


abs

rel


Weighted least square:

None


Ordinary least square:

None


Probabilities that GCOS criteria is met:

Weighted least square:

None %

Ordinary least square:

None %


DHR statistics

Temporal stability [1/decade]:


abs

rel


Weighted least square:

None


Ordinary least square:

None


Probabilities that GCOS criteria is met:

Weighted least square:

None %

Ordinary least square:

None %


Temporal anomaly analyis

The variance of the temporal anomalies provides an additional measure about the stability of the signal AFTER removal of the mean seasonal cylce.

+000 deg


+057/+063 deg