KONZA_EDC


Location

lon / lat [deg]: -96.6096 / 39.1023

Source network: AERONET


Geostationary surface albedo (GSA) data


“+000”


“+057/+063”


Landcover information (based on ESA CCI landcover data)


Landcover fractions @ 2km distance


Landcover fractions @ 20 km distance


Legend


Distance to open water bodies [km]:

3.55

Distance to urban areas [km]:

5.67


Radius: 1 km

Number of landcover classes:

2

Dominant landcover type:

130: grassland

Fraction of dominant landcover type [%]:

93.0


Radius: 2 km

Number of landcover classes:

2

Dominant landcover type:

130: grassland

Fraction of dominant landcover type [%]:

92.0


Radius: 5 km

Number of landcover classes:

4

Dominant landcover type:

130: grassland

Fraction of dominant landcover type [%]:

83.0


Radius: 10 km

Number of landcover classes:

5

Dominant landcover type:

130: grassland

Fraction of dominant landcover type [%]:

74.0


Radius: 20 km

Number of landcover classes:

5

Dominant landcover type:

130: grassland

Fraction of dominant landcover type [%]:

77.0


Disturbances


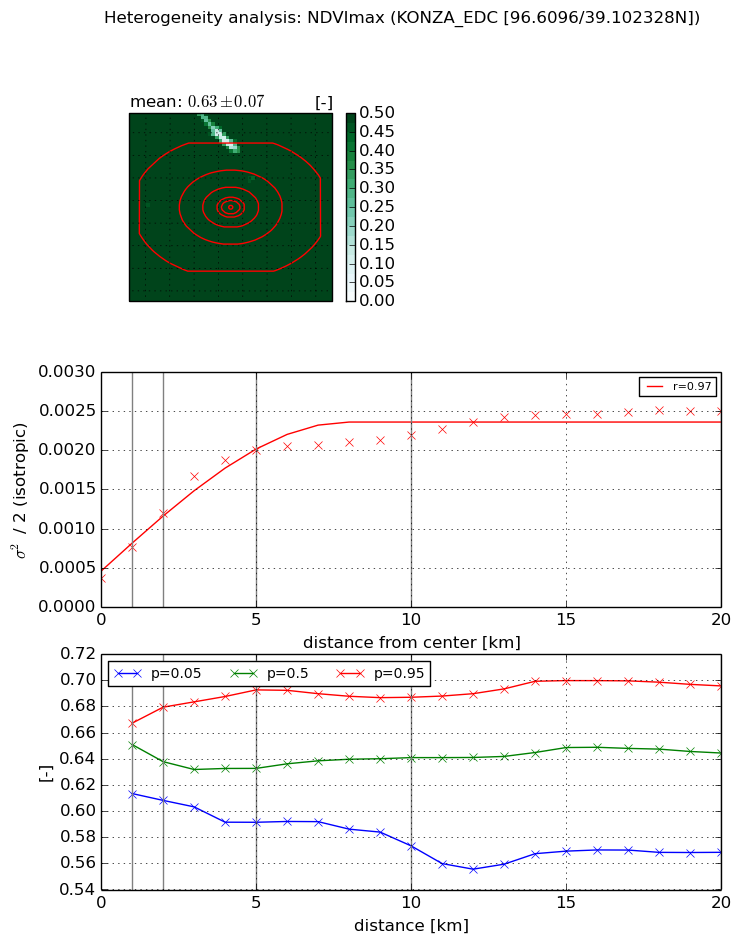
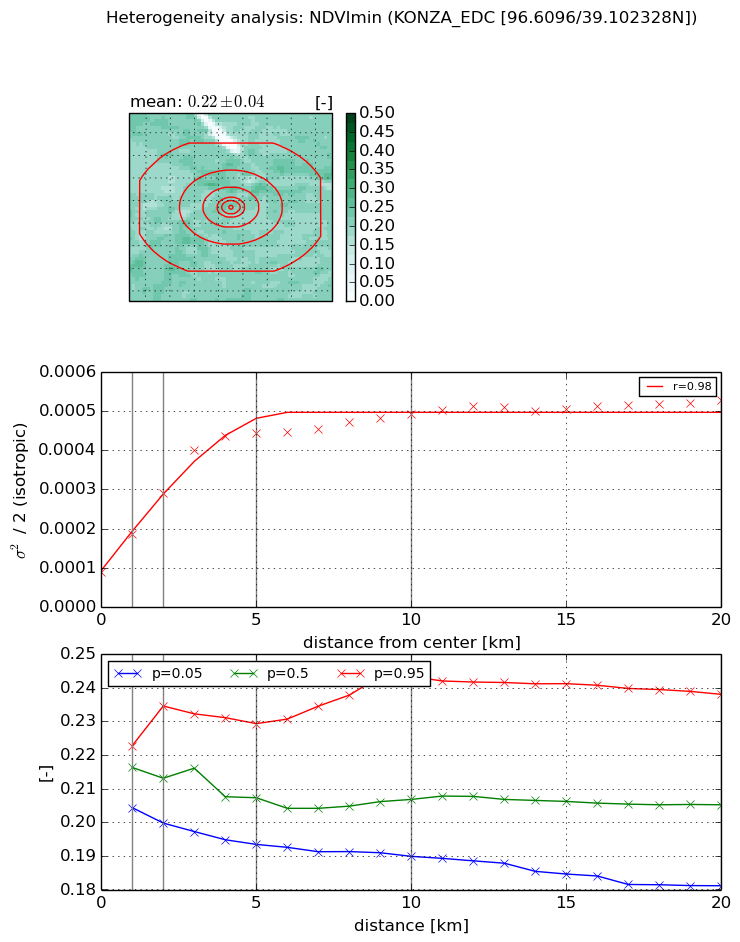
Heterogeneity analysis

The heterogeneity analysis provides information about the spatial and temporal heterogeneity of the site.

Topography


Roman et al. (2009) index


St

2.62886775545

Rcv

0.141171144188

Rse

0.0

Rst

-4.55541826341e-06

Rsv

-1.0


Height range @ 1km [m]

54

Height range @ 2km [m]

81

Height range @ 5km [m]

112

Height range @ 10km [m]

-999

Height range @ 20km [m]

-999


Variance slope @ 1 km

244

Variance slope @ 2 km

226

Variance slope @ 5 km

251

Variance slope @ 10 km

-999

Variance slope @ 20 km

-999


NDVI (max. NDVI composite)


Roman et al. (2009) index


St

0.896779769988

Rcv

0.156328626929

Rse

0.0

Rst

0.155298441371

Rsv

3.0336758705


NDVI range @ 1km [-]

0.05

NDVI range @ 2km [-]

0.07

NDVI range @ 5km [-]

0.1

NDVI range @ 10km [-]

0.11

NDVI range @ 20km [-]

0.13


Variance slope @ 1 km

0.000394068305976

Variance slope @ 2 km

0.000411415824186

Variance slope @ 5 km

0.000341231540136

Variance slope @ 10 km

0.000166074436462

Variance slope @ 20 km

8.09634969102e-05


NDVI (min. NDVI composite)I


Roman et al. (2009) index


St

20.4923178651

Rcv

0.00282248005722

Rse

0.0

Rst

-0.0370707100922

Rsv

-0.106503133573


NDVI range @ 1km [-]

0.02

NDVI range @ 2km [-]

0.03

NDVI range @ 5km [-]

0.04

NDVI range @ 10km [-]

0.05

NDVI range @ 20km [-]

0.06


NDVI slope @ 1 km

9.60339924725e-05

NDVI slope @ 2 km

0.000100107879211

NDVI slope @ 5 km

7.50550199279e-05

NDVI slope @ 10 km

3.50108763602e-05

NDVI slope @ 20 km

1.45983087289e-05


Temporal stability analysis

+000 deg (BHR)


BHR statistics

Temporal stability [1/decade]:


abs

rel


Weighted least square:

None


Ordinary least square:

None


Probabilities that GCOS criteria is met:

Weighted least square:

None %

Ordinary least square:

None %


DHR statistics

Temporal stability [1/decade]:


abs

rel


Weighted least square:

None


Ordinary least square:

None


Probabilities that GCOS criteria is met:

Weighted least square:

None %

Ordinary least square:

None %


+057/+063 deg (BHR)


BHR statistics

Temporal stability [1/decade]:


abs

rel


Weighted least square:

None


Ordinary least square:

None


Probabilities that GCOS criteria is met:

Weighted least square:

None %

Ordinary least square:

None %


DHR statistics

Temporal stability [1/decade]:


abs

rel


Weighted least square:

None


Ordinary least square:

None


Probabilities that GCOS criteria is met:

Weighted least square:

None %

Ordinary least square:

None %


Temporal anomaly analyis

The variance of the temporal anomalies provides an additional measure about the stability of the signal AFTER removal of the mean seasonal cylce.

+000 deg


+057/+063 deg