KOREA_UNIVERSITY


Location

lon / lat [deg]: 127.0251 / 37.5851

Source network: AERONET


Geostationary surface albedo (GSA) data


“+000”


“+057/+063”


Landcover information (based on ESA CCI landcover data)


Landcover fractions @ 2km distance


Landcover fractions @ 20 km distance


Legend


Distance to open water bodies [km]:

4.0

Distance to urban areas [km]:

0.13


Radius: 1 km

Number of landcover classes:

1

Dominant landcover type:

190: urban areas

Fraction of dominant landcover type [%]:

100.0


Radius: 2 km

Number of landcover classes:

1

Dominant landcover type:

190: urban areas

Fraction of dominant landcover type [%]:

100.0


Radius: 5 km

Number of landcover classes:

5

Dominant landcover type:

190: urban areas

Fraction of dominant landcover type [%]:

94.0


Radius: 10 km

Number of landcover classes:

5

Dominant landcover type:

190: urban areas

Fraction of dominant landcover type [%]:

81.0


Radius: 20 km

Number of landcover classes:

5

Dominant landcover type:

190: urban areas

Fraction of dominant landcover type [%]:

58.0


Disturbances


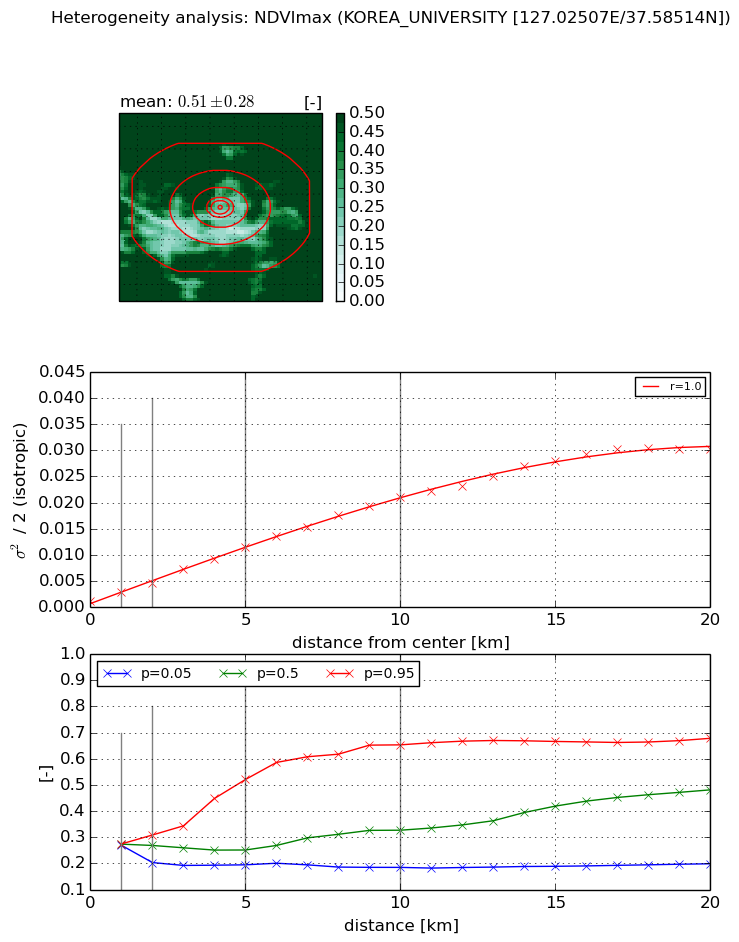
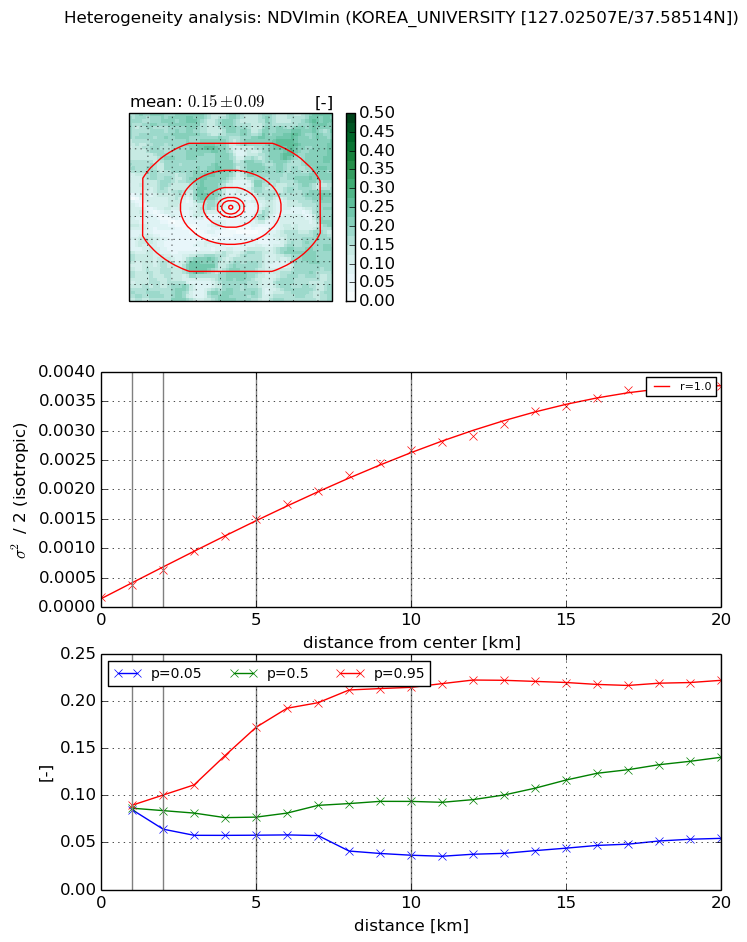
Heterogeneity analysis

The heterogeneity analysis provides information about the spatial and temporal heterogeneity of the site.

Topography


Roman et al. (2009) index


St

2.5816826761e-05

Rcv

0.513040967746

Rse

0.0

Rst

-0.0282468222715

Rsv

116202.740695


Height range @ 1km [m]

61

Height range @ 2km [m]

80

Height range @ 5km [m]

166

Height range @ 10km [m]

-999

Height range @ 20km [m]

-999


Variance slope @ 1 km

1163

Variance slope @ 2 km

879

Variance slope @ 5 km

679

Variance slope @ 10 km

-999

Variance slope @ 20 km

-999


NDVI (max. NDVI composite)


Roman et al. (2009) index


St

4.67386965013

Rcv

0.630975904357

Rse

0.0

Rst

-5.20192109041e-10

Rsv

0.0108905194285


NDVI range @ 1km [-]

0.01

NDVI range @ 2km [-]

0.11

NDVI range @ 5km [-]

0.33

NDVI range @ 10km [-]

0.47

NDVI range @ 20km [-]

0.48


Variance slope @ 1 km

0.00160202171082

Variance slope @ 2 km

0.00172965513636

Variance slope @ 5 km

0.00207051779684

Variance slope @ 10 km

0.00203764693162

Variance slope @ 20 km

0.00156215944129


NDVI (min. NDVI composite)I


Roman et al. (2009) index


St

3.60737387961

Rcv

0.732075532491

Rse

0.0

Rst

1.66951495942e-09

Rsv

-0.0995543717266


NDVI range @ 1km [-]

0.0

NDVI range @ 2km [-]

0.04

NDVI range @ 5km [-]

0.11

NDVI range @ 10km [-]

0.18

NDVI range @ 20km [-]

0.17


NDVI slope @ 1 km

0.000212683298996

NDVI slope @ 2 km

0.000230173844172

NDVI slope @ 5 km

0.000270572783189

NDVI slope @ 10 km

0.000256632467116

NDVI slope @ 20 km

0.000188714978305


Temporal stability analysis

+000 deg (BHR)


BHR statistics

Temporal stability [1/decade]:


abs

rel


Weighted least square:

None


Ordinary least square:

None


Probabilities that GCOS criteria is met:

Weighted least square:

None %

Ordinary least square:

None %


DHR statistics

Temporal stability [1/decade]:


abs

rel


Weighted least square:

None


Ordinary least square:

None


Probabilities that GCOS criteria is met:

Weighted least square:

None %

Ordinary least square:

None %


+057/+063 deg (BHR)


BHR statistics

Temporal stability [1/decade]:


abs

rel


Weighted least square:

-99999.0


Ordinary least square:

-99999.0


Probabilities that GCOS criteria is met:

Weighted least square:

-99999.0 %

Ordinary least square:

-99999.0 %


DHR statistics

Temporal stability [1/decade]:


abs

rel


Weighted least square:

-99999.0


Ordinary least square:

-99999.0


Probabilities that GCOS criteria is met:

Weighted least square:

-99999.0 %

Ordinary least square:

-99999.0 %


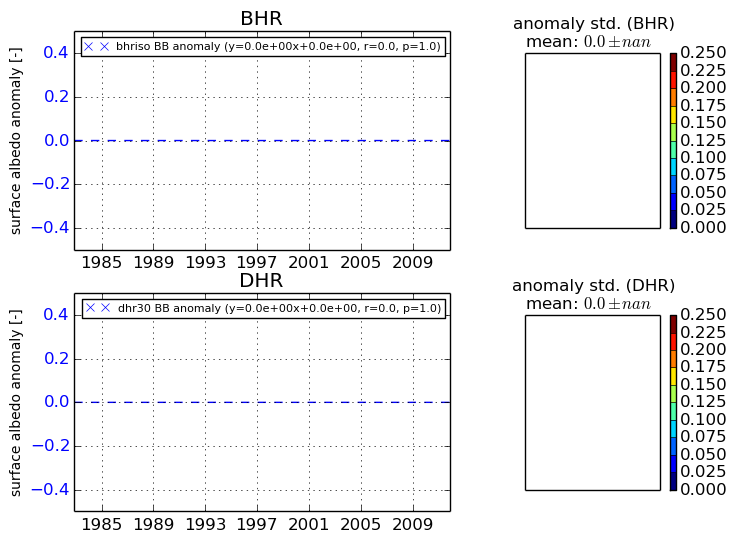
Temporal anomaly analyis

The variance of the temporal anomalies provides an additional measure about the stability of the signal AFTER removal of the mean seasonal cylce.

+000 deg


+057/+063 deg