KUNLUN_GODDESS


Location

lon / lat [deg]: 81.03 / 35.32

Source network: ALBEDOVAL2


Geostationary surface albedo (GSA) data


“+000”


“+057/+063”


Landcover information (based on ESA CCI landcover data)


Landcover fractions @ 2km distance


Landcover fractions @ 20 km distance


Legend


Distance to open water bodies [km]:

10.64

Distance to urban areas [km]:

none in region


Radius: 1 km

Number of landcover classes:

1

Dominant landcover type:

220: permanent snow and ice

Fraction of dominant landcover type [%]:

100.0


Radius: 2 km

Number of landcover classes:

1

Dominant landcover type:

220: permanent snow and ice

Fraction of dominant landcover type [%]:

100.0


Radius: 5 km

Number of landcover classes:

1

Dominant landcover type:

220: permanent snow and ice

Fraction of dominant landcover type [%]:

100.0


Radius: 10 km

Number of landcover classes:

2

Dominant landcover type:

220: permanent snow and ice

Fraction of dominant landcover type [%]:

99.0


Radius: 20 km

Number of landcover classes:

2

Dominant landcover type:

220: permanent snow and ice

Fraction of dominant landcover type [%]:

84.0


Disturbances


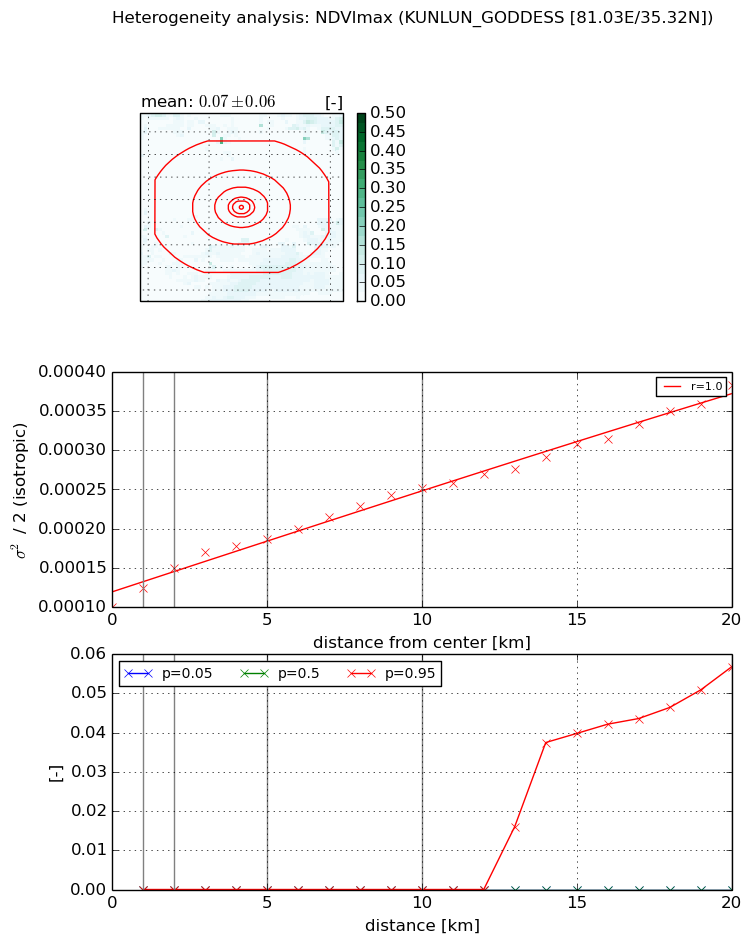
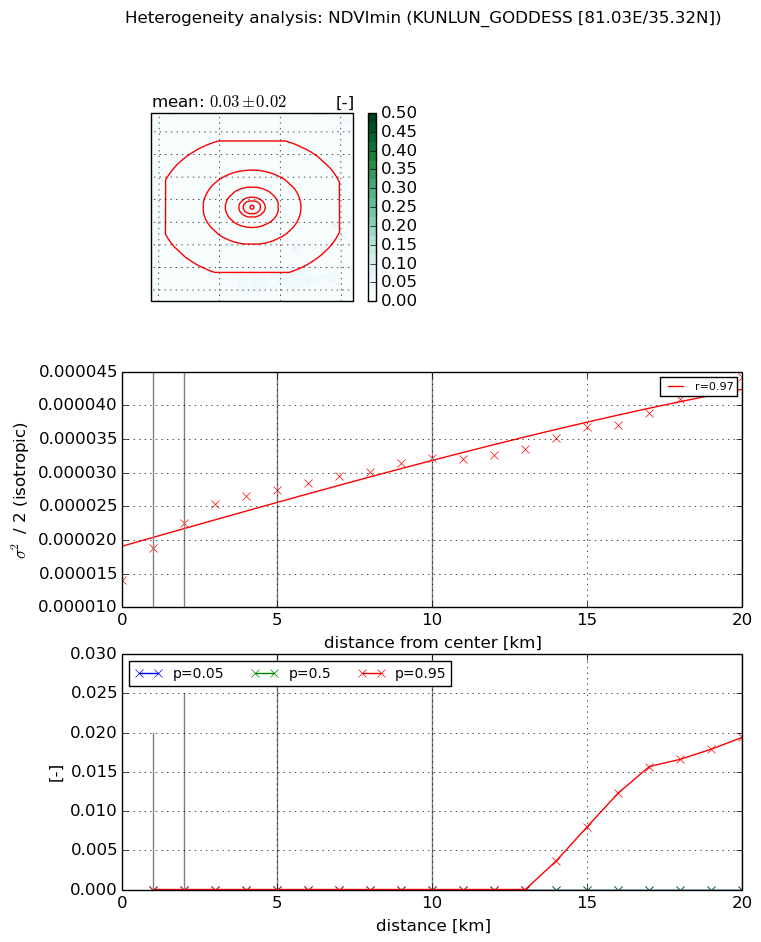
Heterogeneity analysis

The heterogeneity analysis provides information about the spatial and temporal heterogeneity of the site.

Topography


Roman et al. (2009) index


St

2.457573439

Rcv

0.207082742506

Rse

0.0

Rst

-0.0139328104588

Rsv

-0.999700765168


Height range @ 1km [m]

128

Height range @ 2km [m]

231

Height range @ 5km [m]

356

Height range @ 10km [m]

-999

Height range @ 20km [m]

-999


Variance slope @ 1 km

3273

Variance slope @ 2 km

3379

Variance slope @ 5 km

2720

Variance slope @ 10 km

-999

Variance slope @ 20 km

-999


NDVI (max. NDVI composite)


Roman et al. (2009) index


St

nan

Rcv

nan

Rse

nan

Rst

nan

Rsv

nan


NDVI range @ 1km [-]

0.0

NDVI range @ 2km [-]

0.0

NDVI range @ 5km [-]

0.0

NDVI range @ 10km [-]

0.0

NDVI range @ 20km [-]

0.06


Variance slope @ 1 km

2.48590490913e-05

Variance slope @ 2 km

2.47449345738e-05

Variance slope @ 5 km

1.75319451261e-05

Variance slope @ 10 km

1.43369042062e-05

Variance slope @ 20 km

1.26717621755e-05


NDVI (min. NDVI composite)I


Roman et al. (2009) index


St

nan

Rcv

nan

Rse

nan

Rst

nan

Rsv

nan


NDVI range @ 1km [-]

0.0

NDVI range @ 2km [-]

0.0

NDVI range @ 5km [-]

0.0

NDVI range @ 10km [-]

0.0

NDVI range @ 20km [-]

0.02


NDVI slope @ 1 km

4.8226417233e-06

NDVI slope @ 2 km

4.30549220941e-06

NDVI slope @ 5 km

2.67865441872e-06

NDVI slope @ 10 km

1.58740784864e-06

NDVI slope @ 20 km

1.17921490075e-06


Temporal stability analysis

+000 deg (BHR)


BHR statistics

Temporal stability [1/decade]:


abs

rel


Weighted least square:

None


Ordinary least square:

None


Probabilities that GCOS criteria is met:

Weighted least square:

None %

Ordinary least square:

None %


DHR statistics

Temporal stability [1/decade]:


abs

rel


Weighted least square:

None


Ordinary least square:

None


Probabilities that GCOS criteria is met:

Weighted least square:

None %

Ordinary least square:

None %


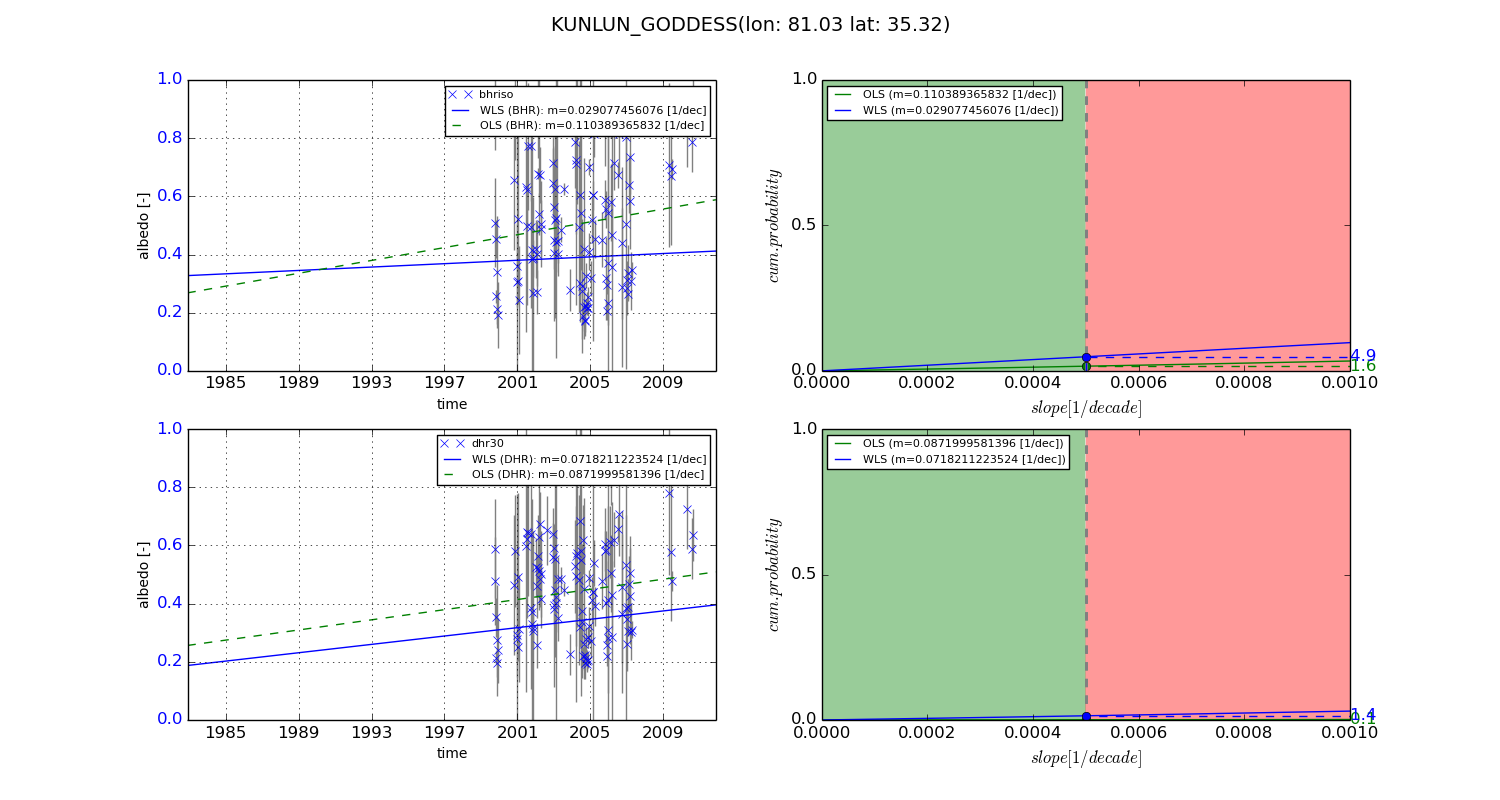
+057/+063 deg (BHR)


BHR statistics

Temporal stability [1/decade]:


abs

rel


Weighted least square:

0.029077456076


Ordinary least square:

0.110389365832


Probabilities that GCOS criteria is met:

Weighted least square:

4.9 %

Ordinary least square:

1.6 %


DHR statistics

Temporal stability [1/decade]:


abs

rel


Weighted least square:

0.0718211223524


Ordinary least square:

0.0871999581396


Probabilities that GCOS criteria is met:

Weighted least square:

1.4 %

Ordinary least square:

0.1 %


Temporal anomaly analyis

The variance of the temporal anomalies provides an additional measure about the stability of the signal AFTER removal of the mean seasonal cylce.

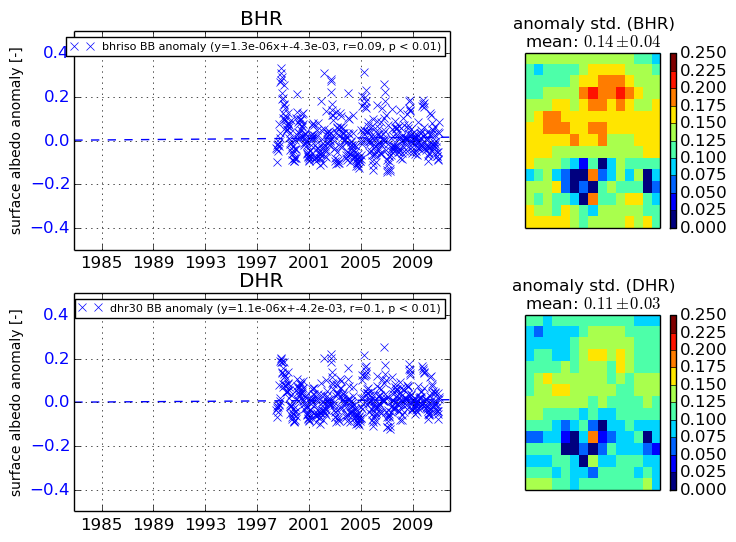
+000 deg


+057/+063 deg