KUOPIO


Location

lon / lat [deg]: 27.6336 / 62.8924

Source network: AERONET


Geostationary surface albedo (GSA) data


“+000”


“+057/+063”


Landcover information (based on ESA CCI landcover data)


Landcover fractions @ 2km distance


Landcover fractions @ 20 km distance


Legend


Distance to open water bodies [km]:

0.39

Distance to urban areas [km]:

0.09


Radius: 1 km

Number of landcover classes:

3

Dominant landcover type:

190: urban areas

Fraction of dominant landcover type [%]:

72.0


Radius: 2 km

Number of landcover classes:

3

Dominant landcover type:

190: urban areas

Fraction of dominant landcover type [%]:

76.0


Radius: 5 km

Number of landcover classes:

3

Dominant landcover type:

190: urban areas

Fraction of dominant landcover type [%]:

36.0


Radius: 10 km

Number of landcover classes:

5

Dominant landcover type:

210: water bodies

Fraction of dominant landcover type [%]:

48.0


Radius: 20 km

Number of landcover classes:

7

Dominant landcover type:

70: Tree cover, needleleaved, evergreen, closed to open (>15%)

Fraction of dominant landcover type [%]:

37.0


Disturbances


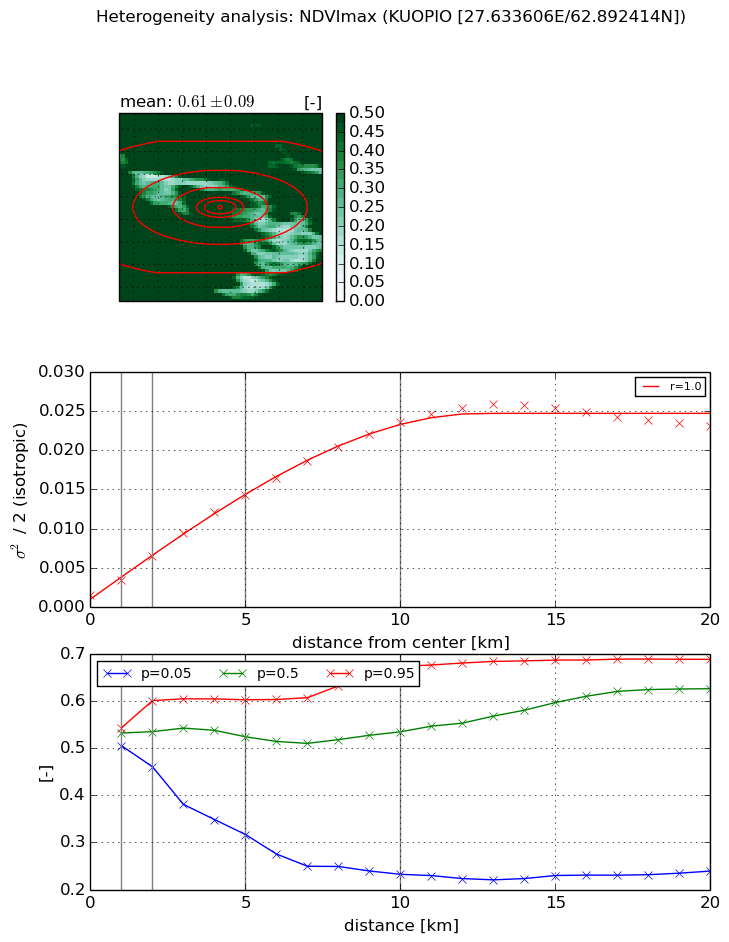
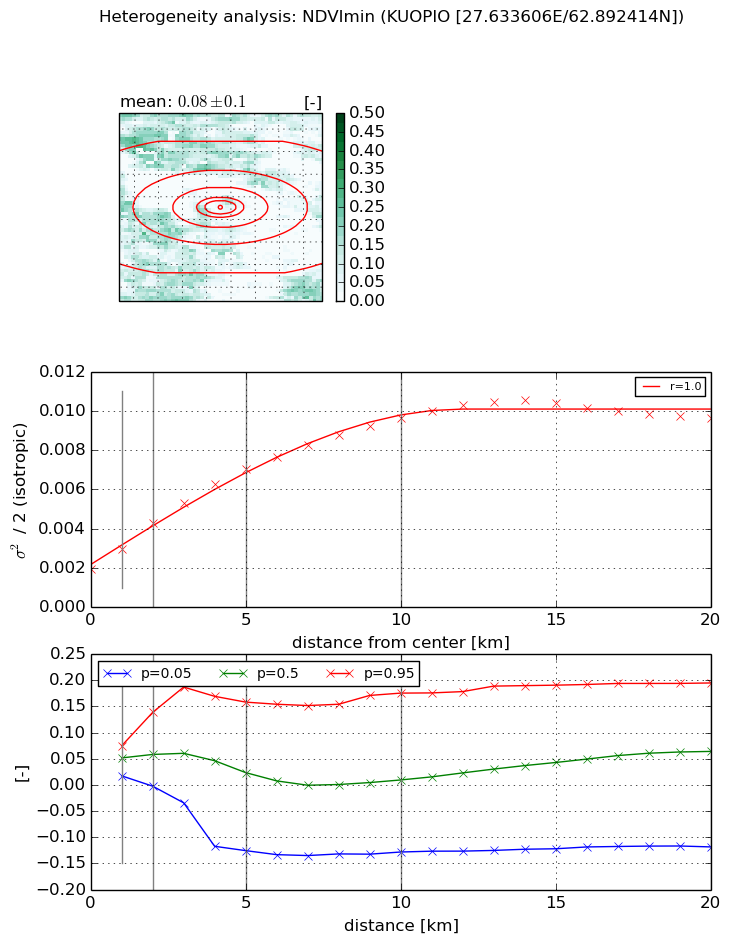
Heterogeneity analysis

The heterogeneity analysis provides information about the spatial and temporal heterogeneity of the site.

Topography


Roman et al. (2009) index


St

13.2569806206

Rcv

-0.115291531801

Rse

0.0

Rst

0.0548497142199

Rsv

-0.0561546267613


Height range @ 1km [m]

42

Height range @ 2km [m]

69

Height range @ 5km [m]

73

Height range @ 10km [m]

-999

Height range @ 20km [m]

-999


Variance slope @ 1 km

292

Variance slope @ 2 km

219

Variance slope @ 5 km

87

Variance slope @ 10 km

-999

Variance slope @ 20 km

-999


NDVI (max. NDVI composite)


Roman et al. (2009) index


St

6.50212869633e-08

Rcv

0.422026615784

Rse

0.0

Rst

-0.0383872013494

Rsv

46138735.6383


NDVI range @ 1km [-]

0.04

NDVI range @ 2km [-]

0.14

NDVI range @ 5km [-]

0.29

NDVI range @ 10km [-]

0.44

NDVI range @ 20km [-]

0.45


Variance slope @ 1 km

0.00196323027161

Variance slope @ 2 km

0.00249759916044

Variance slope @ 5 km

0.00264964350975

Variance slope @ 10 km

0.00226338581495

Variance slope @ 20 km

0.00109481497946


NDVI (min. NDVI composite)I


Roman et al. (2009) index


St

nan

Rcv

nan

Rse

nan

Rst

nan

Rsv

nan


NDVI range @ 1km [-]

0.06

NDVI range @ 2km [-]

0.14

NDVI range @ 5km [-]

0.28

NDVI range @ 10km [-]

0.3

NDVI range @ 20km [-]

0.31


NDVI slope @ 1 km

0.0010563713247

NDVI slope @ 2 km

0.00117319294912

NDVI slope @ 5 km

0.00103867446

NDVI slope @ 10 km

0.000764979535871

NDVI slope @ 20 km

0.000360703147866


Temporal stability analysis

+000 deg (BHR)


BHR statistics

Temporal stability [1/decade]:


abs

rel


Weighted least square:

-99999.0


Ordinary least square:

-99999.0


Probabilities that GCOS criteria is met:

Weighted least square:

-99999.0 %

Ordinary least square:

-99999.0 %


DHR statistics

Temporal stability [1/decade]:


abs

rel


Weighted least square:

-99999.0


Ordinary least square:

-99999.0


Probabilities that GCOS criteria is met:

Weighted least square:

-99999.0 %

Ordinary least square:

-99999.0 %


+057/+063 deg (BHR)


BHR statistics

Temporal stability [1/decade]:


abs

rel


Weighted least square:

-99999.0


Ordinary least square:

-99999.0


Probabilities that GCOS criteria is met:

Weighted least square:

-99999.0 %

Ordinary least square:

-99999.0 %


DHR statistics

Temporal stability [1/decade]:


abs

rel


Weighted least square:

-99999.0


Ordinary least square:

-99999.0


Probabilities that GCOS criteria is met:

Weighted least square:

-99999.0 %

Ordinary least square:

-99999.0 %


Temporal anomaly analyis

The variance of the temporal anomalies provides an additional measure about the stability of the signal AFTER removal of the mean seasonal cylce.

+000 deg


+057/+063 deg