KYIV


Location

lon / lat [deg]: 30.4967 / 50.3636

Source network: AERONET


Geostationary surface albedo (GSA) data


“+000”


“+057/+063”


Landcover information (based on ESA CCI landcover data)


Landcover fractions @ 2km distance


Landcover fractions @ 20 km distance


Legend


Distance to open water bodies [km]:

4.17

Distance to urban areas [km]:

0.81


Radius: 1 km

Number of landcover classes:

6

Dominant landcover type:

60: Tree cover, broadleaved, decidous

Fraction of dominant landcover type [%]:

73.0


Radius: 2 km

Number of landcover classes:

7

Dominant landcover type:

60: Tree cover, broadleaved, decidous

Fraction of dominant landcover type [%]:

32.0


Radius: 5 km

Number of landcover classes:

6

Dominant landcover type:

10: cropland, rainfed

Fraction of dominant landcover type [%]:

41.0


Radius: 10 km

Number of landcover classes:

8

Dominant landcover type:

10: cropland, rainfed

Fraction of dominant landcover type [%]:

40.0


Radius: 20 km

Number of landcover classes:

7

Dominant landcover type:

10: cropland, rainfed

Fraction of dominant landcover type [%]:

40.0


Disturbances


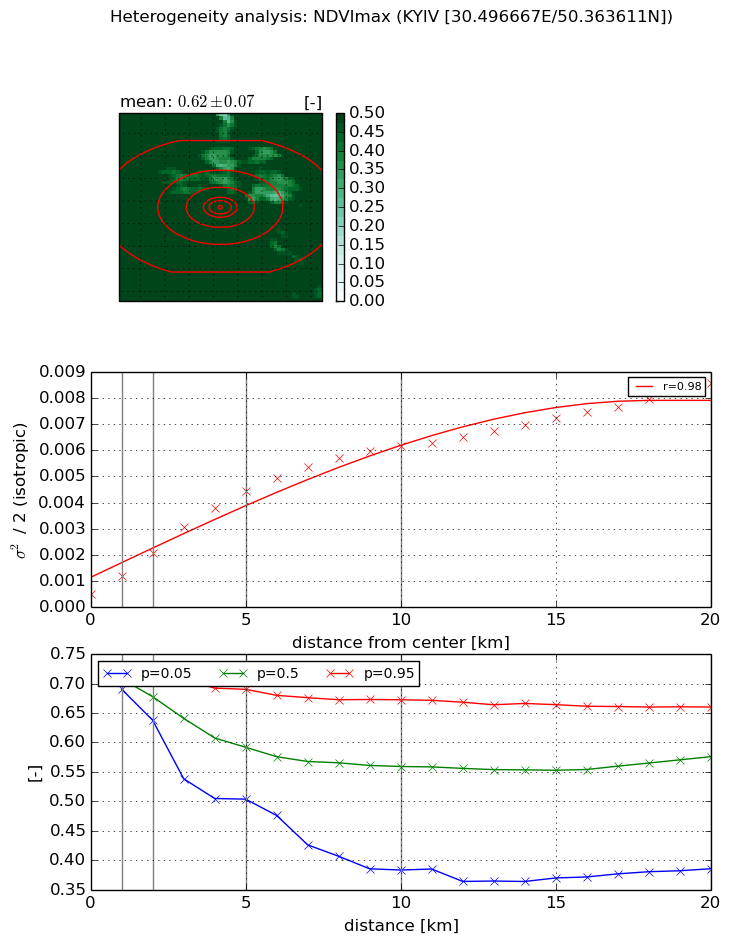
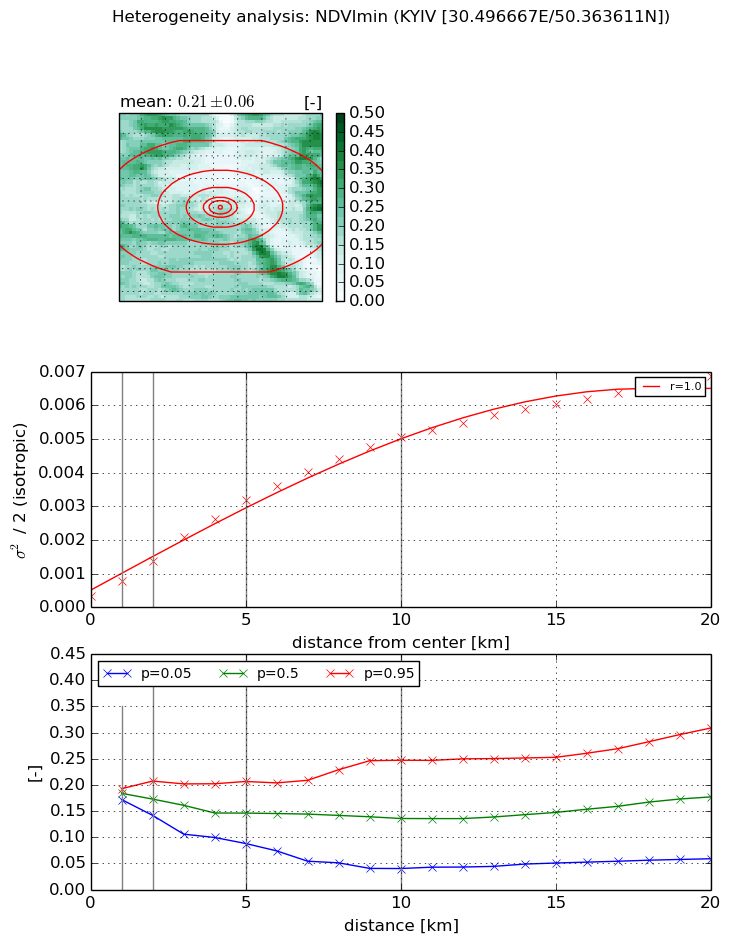
Heterogeneity analysis

The heterogeneity analysis provides information about the spatial and temporal heterogeneity of the site.

Topography


Roman et al. (2009) index


St

1.96589590354

Rcv

0.522035021465

Rse

0.0

Rst

0.00398677582466

Rsv

-1.0


Height range @ 1km [m]

30

Height range @ 2km [m]

57

Height range @ 5km [m]

99

Height range @ 10km [m]

-999

Height range @ 20km [m]

-999


Variance slope @ 1 km

231

Variance slope @ 2 km

200

Variance slope @ 5 km

211

Variance slope @ 10 km

-999

Variance slope @ 20 km

-999


NDVI (max. NDVI composite)


Roman et al. (2009) index


St

3.17806674449

Rcv

0.325411469463

Rse

0.0

Rst

-0.136658367308

Rsv

0.481900268702


NDVI range @ 1km [-]

0.03

NDVI range @ 2km [-]

0.08

NDVI range @ 5km [-]

0.19

NDVI range @ 10km [-]

0.29

NDVI range @ 20km [-]

0.27


Variance slope @ 1 km

0.000680406967473

Variance slope @ 2 km

0.000778960669443

Variance slope @ 5 km

0.000817926111321

Variance slope @ 10 km

0.000584551440207

Variance slope @ 20 km

0.000356007113783


NDVI (min. NDVI composite)I


Roman et al. (2009) index


St

2.29196928699

Rcv

0.383254885521

Rse

0.0

Rst

-0.052826856111

Rsv

0.872836321552


NDVI range @ 1km [-]

0.02

NDVI range @ 2km [-]

0.07

NDVI range @ 5km [-]

0.12

NDVI range @ 10km [-]

0.21

NDVI range @ 20km [-]

0.25


NDVI slope @ 1 km

0.000442528675344

NDVI slope @ 2 km

0.000517125424648

NDVI slope @ 5 km

0.000589898176618

NDVI slope @ 10 km

0.00048701023585

NDVI slope @ 20 km

0.000314950858726


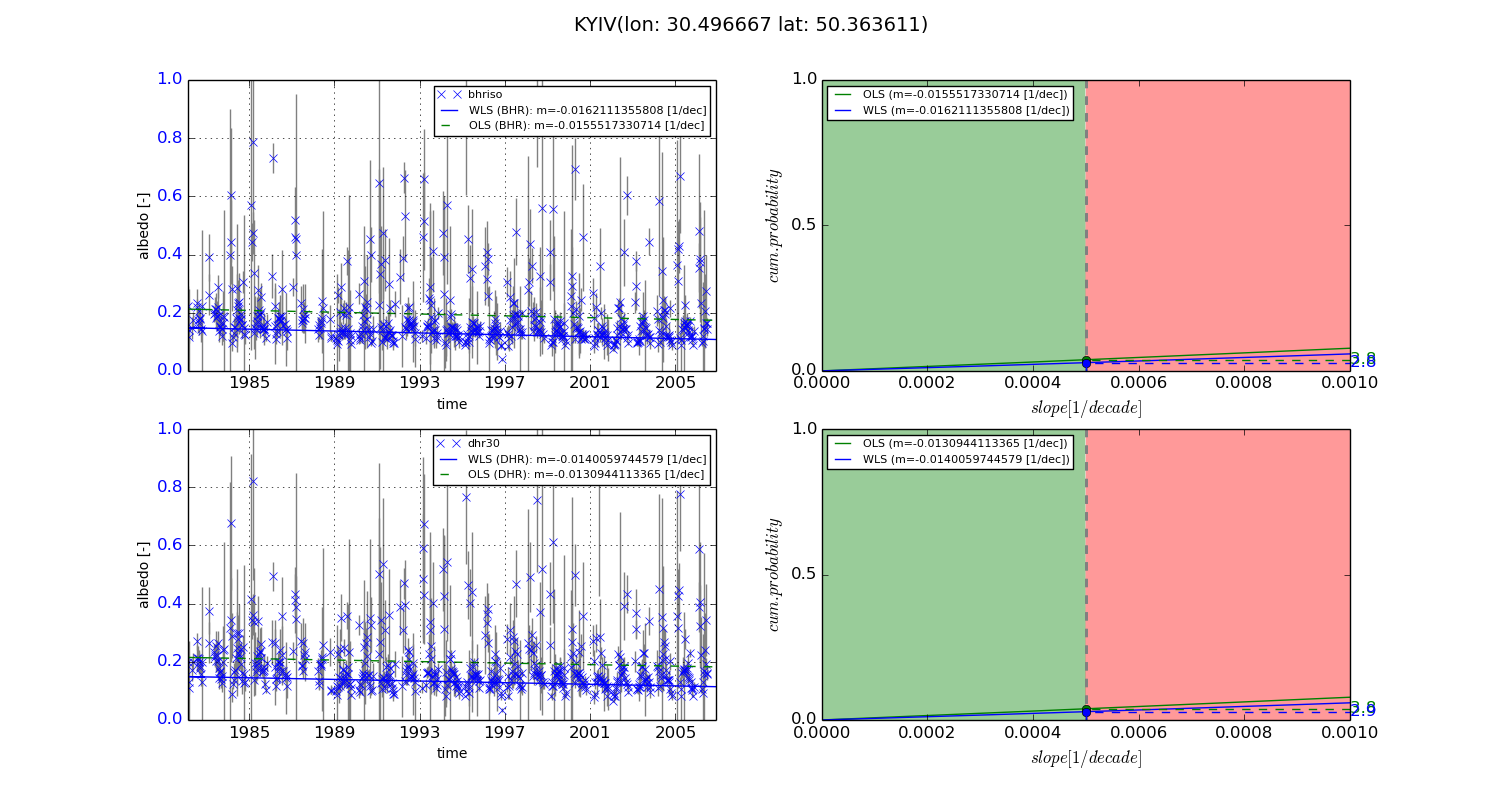
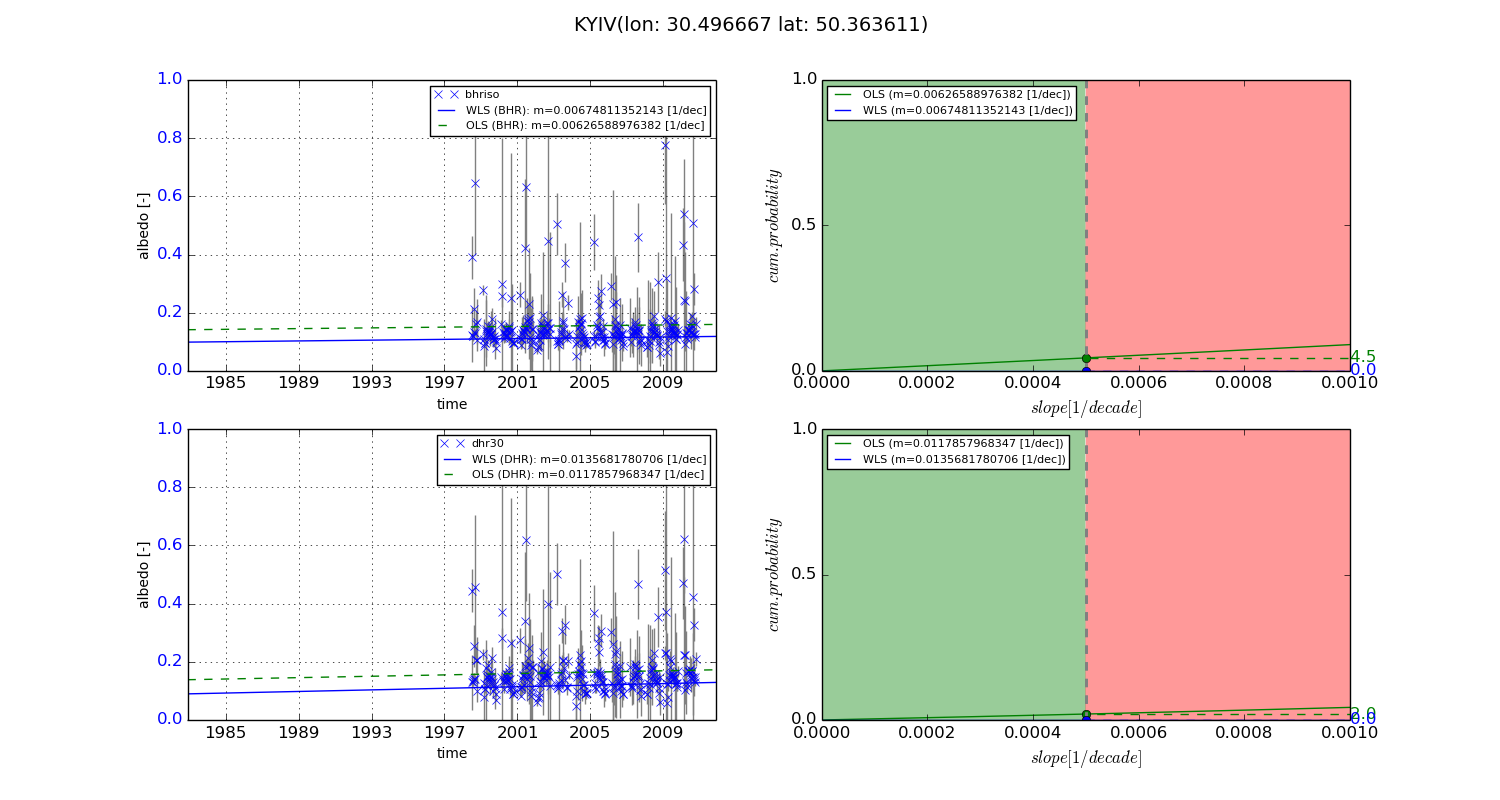
Temporal stability analysis

+000 deg (BHR)


BHR statistics

Temporal stability [1/decade]:


abs

rel


Weighted least square:

-0.0162111355808


Ordinary least square:

-0.0155517330714


Probabilities that GCOS criteria is met:

Weighted least square:

2.8 %

Ordinary least square:

3.8 %


DHR statistics

Temporal stability [1/decade]:


abs

rel


Weighted least square:

-0.0140059744579


Ordinary least square:

-0.0130944113365


Probabilities that GCOS criteria is met:

Weighted least square:

2.9 %

Ordinary least square:

3.8 %


+057/+063 deg (BHR)


BHR statistics

Temporal stability [1/decade]:


abs

rel


Weighted least square:

0.00674811352143


Ordinary least square:

0.00626588976382


Probabilities that GCOS criteria is met:

Weighted least square:

0.0 %

Ordinary least square:

4.5 %


DHR statistics

Temporal stability [1/decade]:


abs

rel


Weighted least square:

0.0135681780706


Ordinary least square:

0.0117857968347


Probabilities that GCOS criteria is met:

Weighted least square:

0.0 %

Ordinary least square:

2.0 %


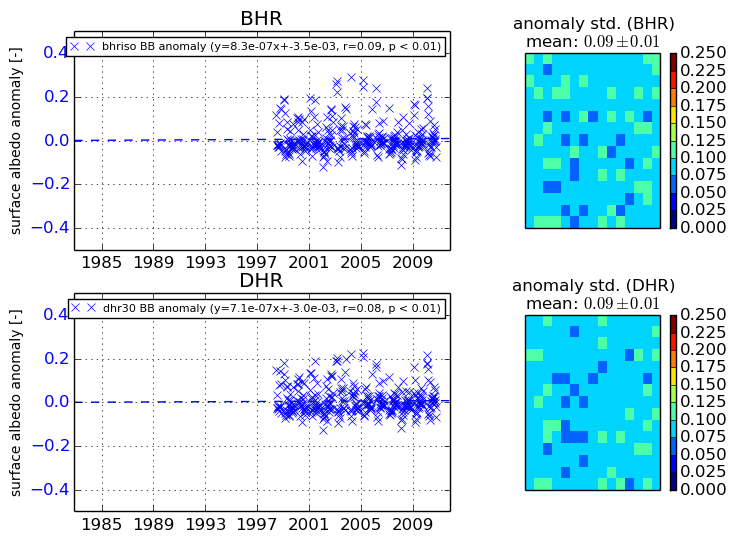
Temporal anomaly analyis

The variance of the temporal anomalies provides an additional measure about the stability of the signal AFTER removal of the mean seasonal cylce.
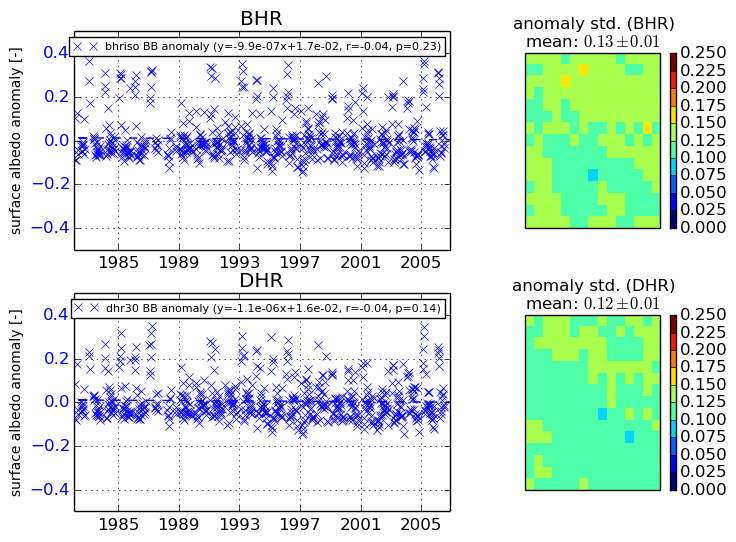
+000 deg


+057/+063 deg