LAEGEREN


Location

lon / lat [deg]: 8.3514 / 47.4803

Source network: AERONET


Geostationary surface albedo (GSA) data


“+000”


“+057/+063”


Landcover information (based on ESA CCI landcover data)


Landcover fractions @ 2km distance


Landcover fractions @ 20 km distance


Legend


Distance to open water bodies [km]:

9.03

Distance to urban areas [km]:

1.19


Radius: 1 km

Number of landcover classes:

4

Dominant landcover type:

60: Tree cover, broadleaved, decidous

Fraction of dominant landcover type [%]:

56.0


Radius: 2 km

Number of landcover classes:

6

Dominant landcover type:

60: Tree cover, broadleaved, decidous

Fraction of dominant landcover type [%]:

32.0


Radius: 5 km

Number of landcover classes:

5

Dominant landcover type:

190: urban areas

Fraction of dominant landcover type [%]:

39.0


Radius: 10 km

Number of landcover classes:

7

Dominant landcover type:

190: urban areas

Fraction of dominant landcover type [%]:

34.0


Radius: 20 km

Number of landcover classes:

8

Dominant landcover type:

190: urban areas

Fraction of dominant landcover type [%]:

33.0


Disturbances


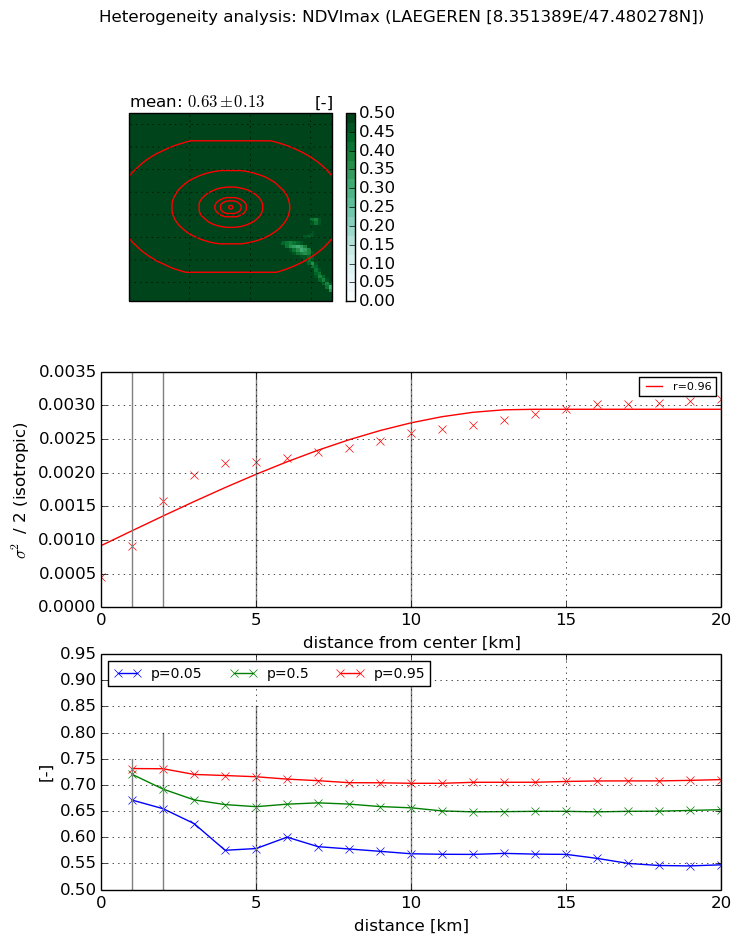
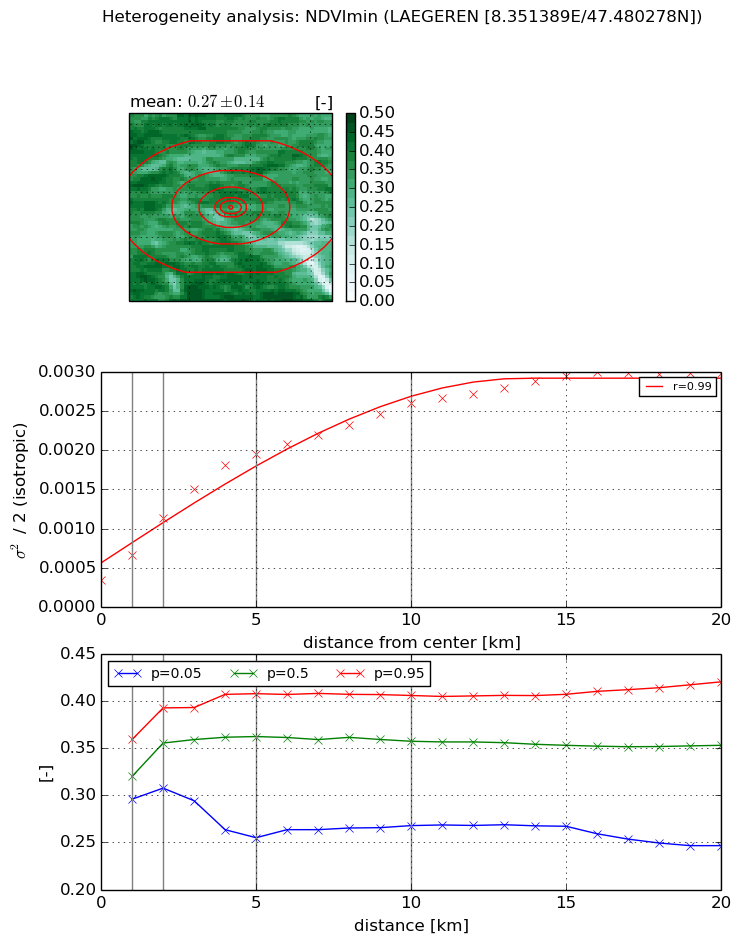
Heterogeneity analysis

The heterogeneity analysis provides information about the spatial and temporal heterogeneity of the site.

Topography


Roman et al. (2009) index


St

9.37312592105

Rcv

-0.00497136596336

Rse

0.0

Rst

-0.0426210223604

Rsv

0.272471593028


Height range @ 1km [m]

294

Height range @ 2km [m]

323

Height range @ 5km [m]

303

Height range @ 10km [m]

-999

Height range @ 20km [m]

-999


Variance slope @ 1 km

3950

Variance slope @ 2 km

4006

Variance slope @ 5 km

1888

Variance slope @ 10 km

-999

Variance slope @ 20 km

-999


NDVI (max. NDVI composite)


Roman et al. (2009) index


St

15.7150247715

Rcv

0.183087692758

Rse

0.0

Rst

-0.00564826035746

Rsv

0.00216415958715


NDVI range @ 1km [-]

0.06

NDVI range @ 2km [-]

0.08

NDVI range @ 5km [-]

0.14

NDVI range @ 10km [-]

0.13

NDVI range @ 20km [-]

0.16


Variance slope @ 1 km

0.000469649692248

Variance slope @ 2 km

0.000563696840904

Variance slope @ 5 km

0.000360723915494

Variance slope @ 10 km

0.00018269218787

Variance slope @ 20 km

0.000102668584206


NDVI (min. NDVI composite)I


Roman et al. (2009) index


St

1.77733687989e-07

Rcv

0.455703427062

Rse

0.0

Rst

0.105271960925

Rsv

16879185.5626


NDVI range @ 1km [-]

0.06

NDVI range @ 2km [-]

0.09

NDVI range @ 5km [-]

0.15

NDVI range @ 10km [-]

0.14

NDVI range @ 20km [-]

0.17


NDVI slope @ 1 km

0.000323513548289

NDVI slope @ 2 km

0.000398836602561

NDVI slope @ 5 km

0.000339054936939

NDVI slope @ 10 km

0.000215400648004

NDVI slope @ 20 km

0.00011733646641


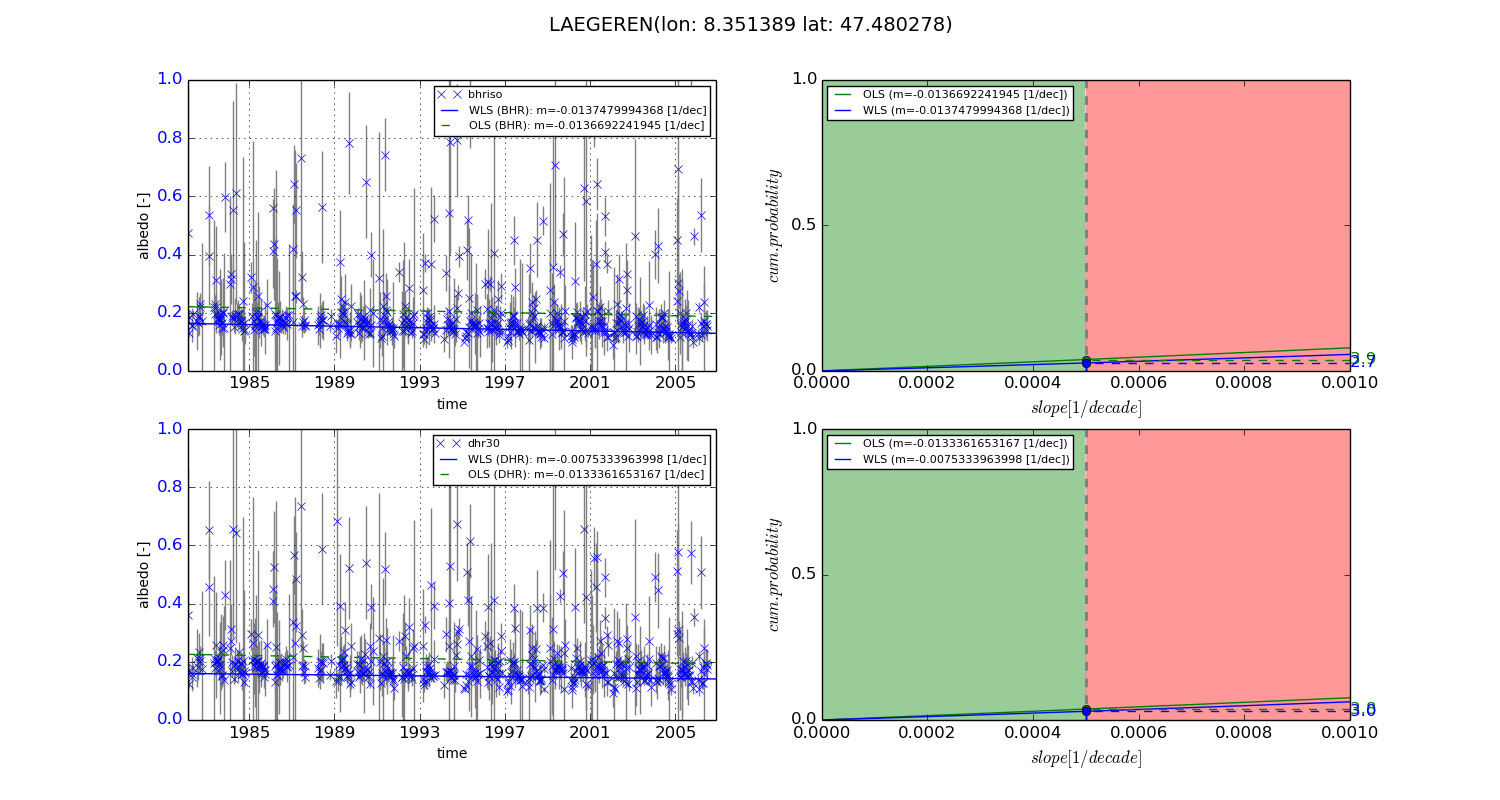
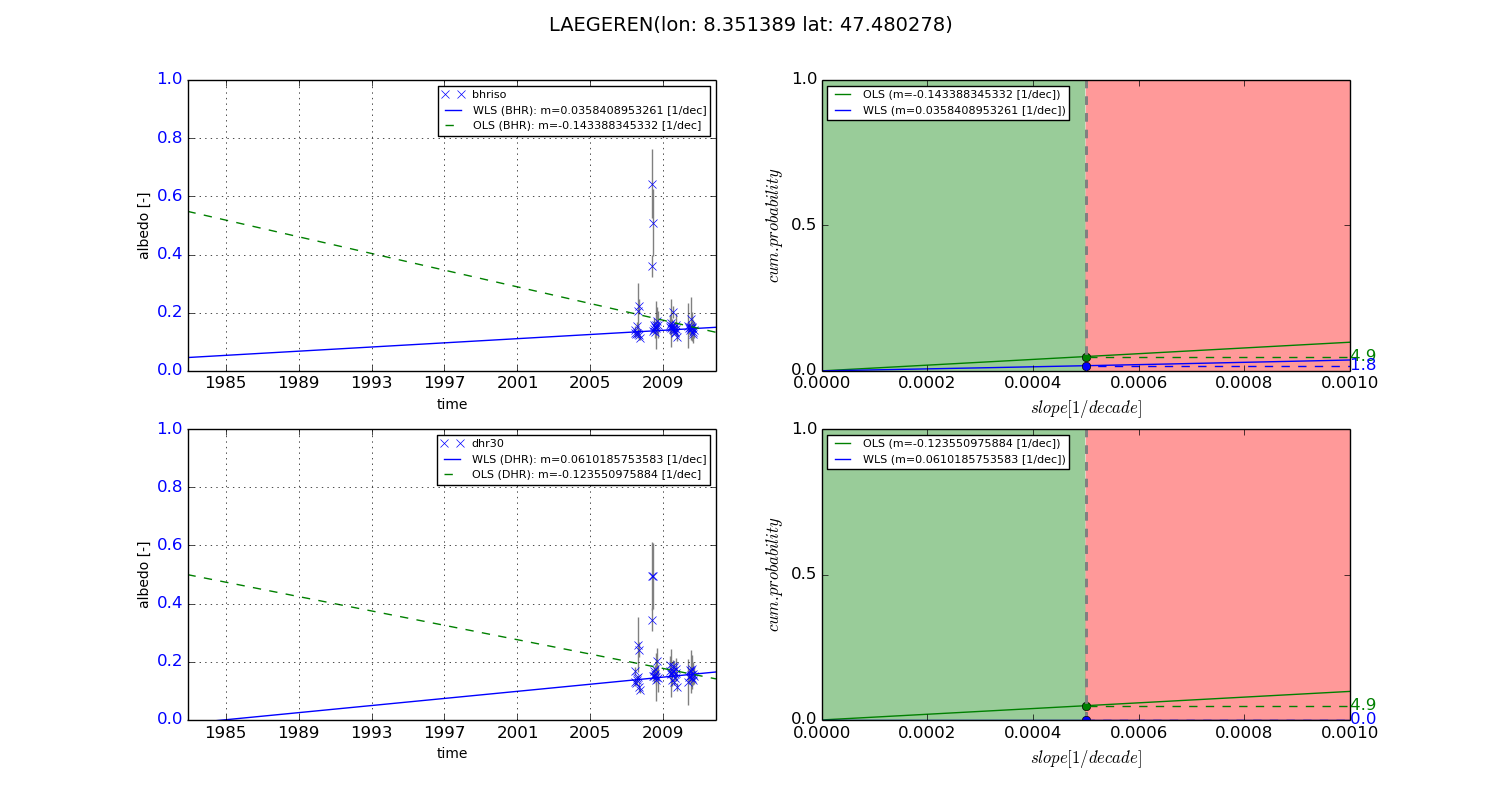
Temporal stability analysis

+000 deg (BHR)


BHR statistics

Temporal stability [1/decade]:


abs

rel


Weighted least square:

-0.0137479994368


Ordinary least square:

-0.0136692241945


Probabilities that GCOS criteria is met:

Weighted least square:

2.7 %

Ordinary least square:

3.9 %


DHR statistics

Temporal stability [1/decade]:


abs

rel


Weighted least square:

-0.0075333963998


Ordinary least square:

-0.0133361653167


Probabilities that GCOS criteria is met:

Weighted least square:

3.0 %

Ordinary least square:

3.8 %


+057/+063 deg (BHR)


BHR statistics

Temporal stability [1/decade]:


abs

rel


Weighted least square:

0.0358408953261


Ordinary least square:

-0.143388345332


Probabilities that GCOS criteria is met:

Weighted least square:

1.8 %

Ordinary least square:

4.9 %


DHR statistics

Temporal stability [1/decade]:


abs

rel


Weighted least square:

0.0610185753583


Ordinary least square:

-0.123550975884


Probabilities that GCOS criteria is met:

Weighted least square:

0.0 %

Ordinary least square:

4.9 %


Temporal anomaly analyis

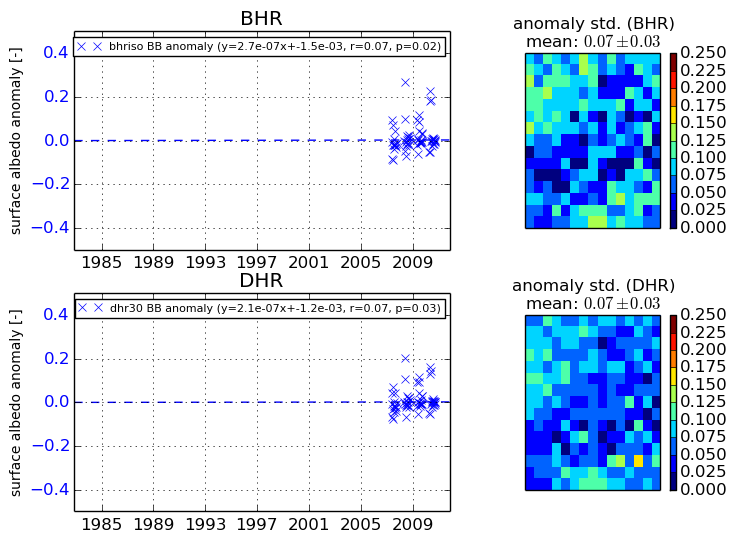
The variance of the temporal anomalies provides an additional measure about the stability of the signal AFTER removal of the mean seasonal cylce.
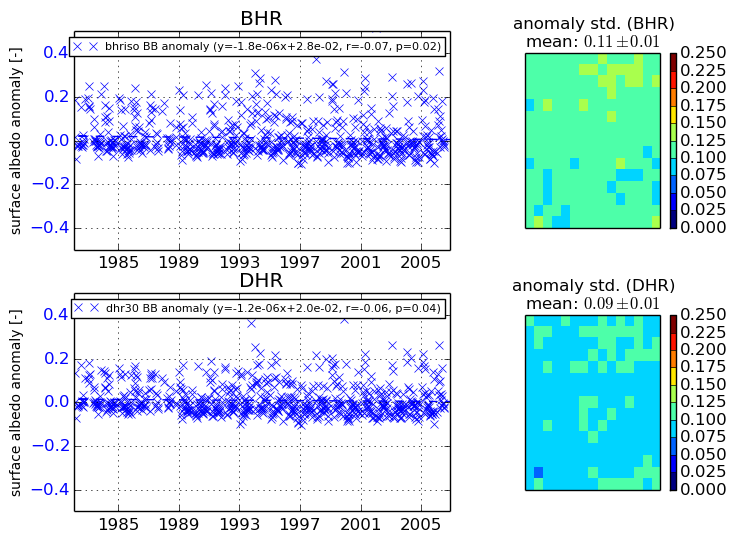
+000 deg


+057/+063 deg