LAKETAHOE


Location

lon / lat [deg]: -120.104 / 39.171

Source network: EOS_LAND


Geostationary surface albedo (GSA) data


“+000”


“+057/+063”


Landcover information (based on ESA CCI landcover data)


Landcover fractions @ 2km distance


Landcover fractions @ 20 km distance


Legend


Distance to open water bodies [km]:

0.02

Distance to urban areas [km]:

1.53


Radius: 1 km

Number of landcover classes:

1

Dominant landcover type:

210: water bodies

Fraction of dominant landcover type [%]:

100.0


Radius: 2 km

Number of landcover classes:

3

Dominant landcover type:

210: water bodies

Fraction of dominant landcover type [%]:

92.0


Radius: 5 km

Number of landcover classes:

3

Dominant landcover type:

210: water bodies

Fraction of dominant landcover type [%]:

79.0


Radius: 10 km

Number of landcover classes:

3

Dominant landcover type:

210: water bodies

Fraction of dominant landcover type [%]:

63.0


Radius: 20 km

Number of landcover classes:

5

Dominant landcover type:

70: Tree cover, needleleaved, evergreen, closed to open (>15%)

Fraction of dominant landcover type [%]:

56.0


Disturbances


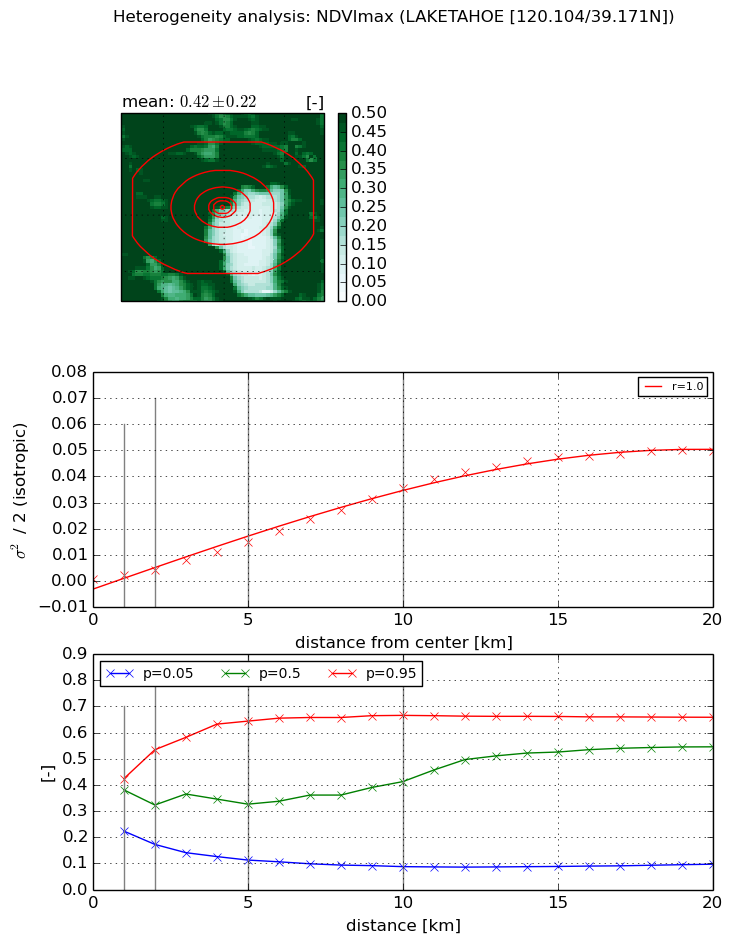
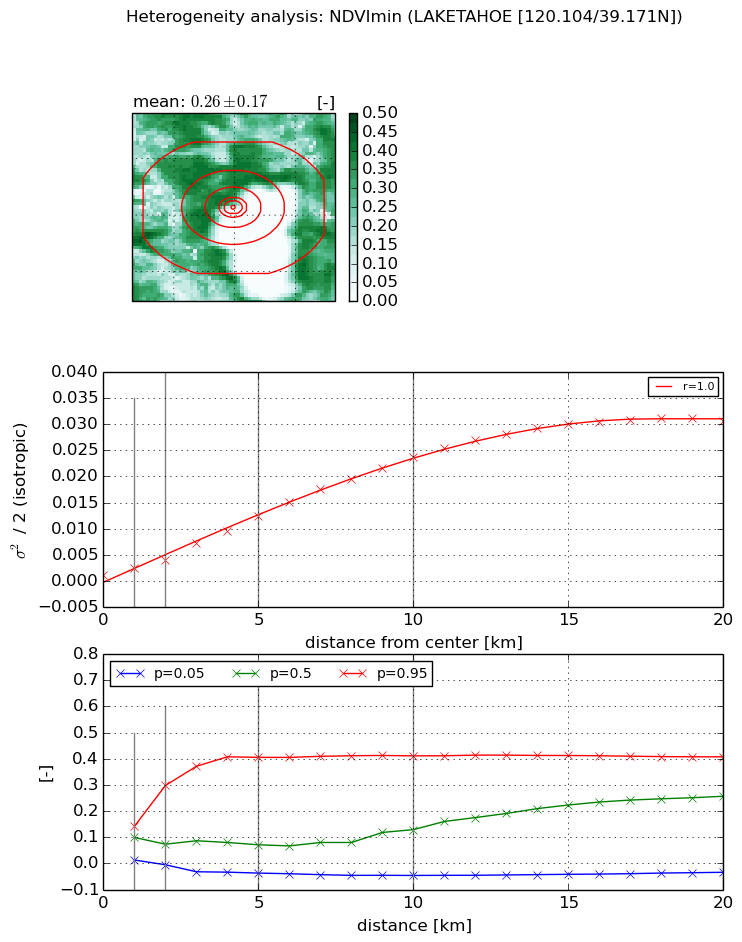
Heterogeneity analysis

The heterogeneity analysis provides information about the spatial and temporal heterogeneity of the site.

Topography


Roman et al. (2009) index


St

0.430434142142

Rcv

1.4731781678

Rse

0.0

Rst

1.42543603007e-06

Rsv

5.49652774705


Height range @ 1km [m]

2

Height range @ 2km [m]

23

Height range @ 5km [m]

185

Height range @ 10km [m]

-999

Height range @ 20km [m]

-999


Variance slope @ 1 km

1239

Variance slope @ 2 km

1542

Variance slope @ 5 km

1598

Variance slope @ 10 km

-999

Variance slope @ 20 km

-999


NDVI (max. NDVI composite)


Roman et al. (2009) index


St

3.14468321359e-06

Rcv

0.234310094741

Rse

0.0

Rst

0.0221249143342

Rsv

953990.907773


NDVI range @ 1km [-]

0.2

NDVI range @ 2km [-]

0.36

NDVI range @ 5km [-]

0.53

NDVI range @ 10km [-]

0.58

NDVI range @ 20km [-]

0.56


Variance slope @ 1 km

0.00139832139309

Variance slope @ 2 km

0.00161306000706

Variance slope @ 5 km

0.00289009222934

Variance slope @ 10 km

0.00362749055561

Variance slope @ 20 km

0.00279588765366


NDVI (min. NDVI composite)I


Roman et al. (2009) index


St

1.20721370249e-07

Rcv

0.0648508013214

Rse

0.0

Rst

0.159850520349

Rsv

24850612.3373


NDVI range @ 1km [-]

0.13

NDVI range @ 2km [-]

0.3

NDVI range @ 5km [-]

0.44

NDVI range @ 10km [-]

0.46

NDVI range @ 20km [-]

0.44


NDVI slope @ 1 km

0.00125846985605

NDVI slope @ 2 km

0.00145325833347

NDVI slope @ 5 km

0.00231929321428

NDVI slope @ 10 km

0.00238374334364

NDVI slope @ 20 km

0.00163126630164


Temporal stability analysis

+000 deg (BHR)


BHR statistics

Temporal stability [1/decade]:


abs

rel


Weighted least square:

None


Ordinary least square:

None


Probabilities that GCOS criteria is met:

Weighted least square:

None %

Ordinary least square:

None %


DHR statistics

Temporal stability [1/decade]:


abs

rel


Weighted least square:

None


Ordinary least square:

None


Probabilities that GCOS criteria is met:

Weighted least square:

None %

Ordinary least square:

None %


+057/+063 deg (BHR)


BHR statistics

Temporal stability [1/decade]:


abs

rel


Weighted least square:

None


Ordinary least square:

None


Probabilities that GCOS criteria is met:

Weighted least square:

None %

Ordinary least square:

None %


DHR statistics

Temporal stability [1/decade]:


abs

rel


Weighted least square:

None


Ordinary least square:

None


Probabilities that GCOS criteria is met:

Weighted least square:

None %

Ordinary least square:

None %


Temporal anomaly analyis

The variance of the temporal anomalies provides an additional measure about the stability of the signal AFTER removal of the mean seasonal cylce.

+000 deg


+057/+063 deg