LAKE_ARGYLE


Location

lon / lat [deg]: 128.7485 / -16.1081

Source network: AERONET


Geostationary surface albedo (GSA) data


“+000”


“+057/+063”


Landcover information (based on ESA CCI landcover data)


Landcover fractions @ 2km distance


Landcover fractions @ 20 km distance


Legend


Distance to open water bodies [km]:

0.18

Distance to urban areas [km]:

34.82


Radius: 1 km

Number of landcover classes:

3

Dominant landcover type:

120: Shrubland

Fraction of dominant landcover type [%]:

65.0


Radius: 2 km

Number of landcover classes:

4

Dominant landcover type:

210: water bodies

Fraction of dominant landcover type [%]:

49.0


Radius: 5 km

Number of landcover classes:

3

Dominant landcover type:

120: Shrubland

Fraction of dominant landcover type [%]:

46.0


Radius: 10 km

Number of landcover classes:

3

Dominant landcover type:

120: Shrubland

Fraction of dominant landcover type [%]:

47.0


Radius: 20 km

Number of landcover classes:

5

Dominant landcover type:

120: Shrubland

Fraction of dominant landcover type [%]:

49.0


Disturbances


Heterogeneity analysis

The heterogeneity analysis provides information about the spatial and temporal heterogeneity of the site.

Topography


Roman et al. (2009) index


St

1.2532484886e-05

Rcv

0.527705645592

Rse

0.0

Rst

-0.0347185353579

Rsv

239377.344454


Height range @ 1km [m]

0

Height range @ 2km [m]

100

Height range @ 5km [m]

243

Height range @ 10km [m]

-999

Height range @ 20km [m]

-999


Variance slope @ 1 km

2968

Variance slope @ 2 km

2289

Variance slope @ 5 km

1084

Variance slope @ 10 km

-999

Variance slope @ 20 km

-999


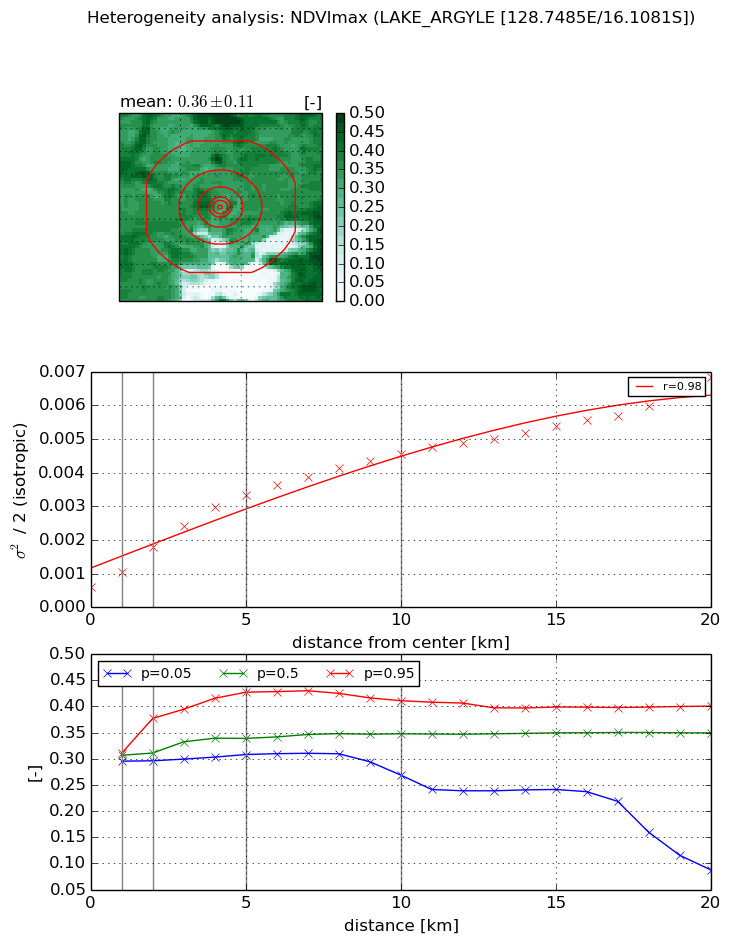
NDVI (max. NDVI composite)


Roman et al. (2009) index


St

3.69715986314

Rcv

0.0519594180852

Rse

0.0

Rst

-0.176452829072

Rsv

0.583021423837


NDVI range @ 1km [-]

0.02

NDVI range @ 2km [-]

0.08

NDVI range @ 5km [-]

0.12

NDVI range @ 10km [-]

0.14

NDVI range @ 20km [-]

0.31


Variance slope @ 1 km

0.000457514650692

Variance slope @ 2 km

0.000595534046628

Variance slope @ 5 km

0.000573356246403

Variance slope @ 10 km

0.000395285802939

Variance slope @ 20 km

0.000265799444982


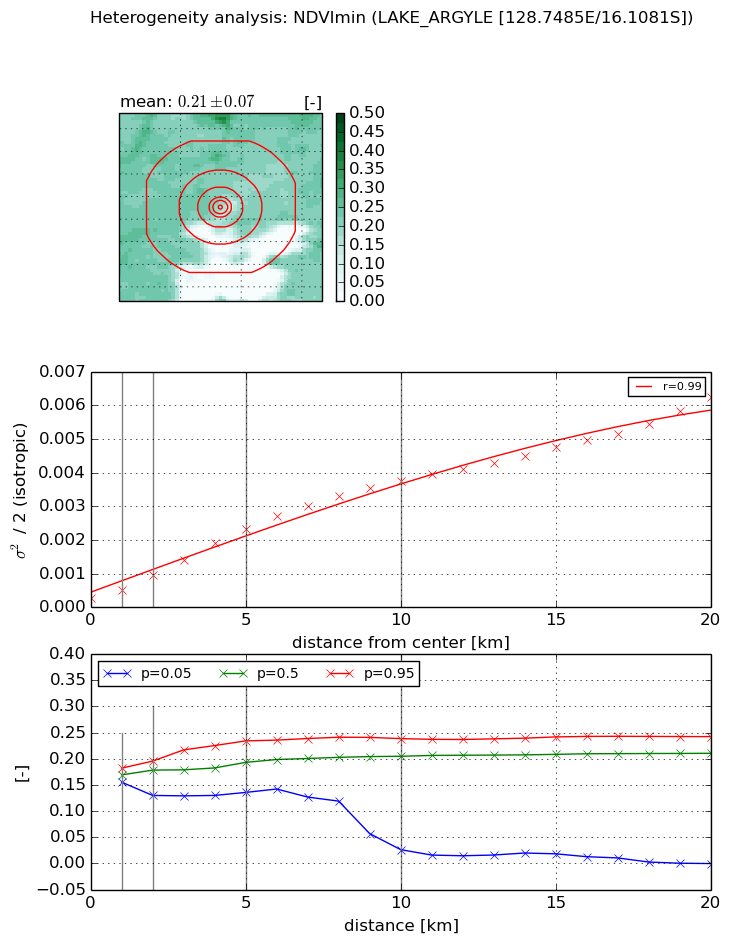
NDVI (min. NDVI composite)I


Roman et al. (2009) index


St

30.8220196344

Rcv

-0.0464887598546

Rse

0.0

Rst

-0.00204699397673

Rsv

-0.0487972579435


NDVI range @ 1km [-]

0.03

NDVI range @ 2km [-]

0.07

NDVI range @ 5km [-]

0.1

NDVI range @ 10km [-]

0.21

NDVI range @ 20km [-]

0.24


NDVI slope @ 1 km

0.00024634644328

NDVI slope @ 2 km

0.000346826419149

NDVI slope @ 5 km

0.000428410964912

NDVI slope @ 10 km

0.000369226040451

NDVI slope @ 20 km

0.000276675718156


Temporal stability analysis

+000 deg (BHR)


BHR statistics

Temporal stability [1/decade]:


abs

rel


Weighted least square:

None


Ordinary least square:

None


Probabilities that GCOS criteria is met:

Weighted least square:

None %

Ordinary least square:

None %


DHR statistics

Temporal stability [1/decade]:


abs

rel


Weighted least square:

None


Ordinary least square:

None


Probabilities that GCOS criteria is met:

Weighted least square:

None %

Ordinary least square:

None %


+057/+063 deg (BHR)


BHR statistics

Temporal stability [1/decade]:


abs

rel


Weighted least square:

-99999.0


Ordinary least square:

-99999.0


Probabilities that GCOS criteria is met:

Weighted least square:

-99999.0 %

Ordinary least square:

-99999.0 %


DHR statistics

Temporal stability [1/decade]:


abs

rel


Weighted least square:

-99999.0


Ordinary least square:

-99999.0


Probabilities that GCOS criteria is met:

Weighted least square:

-99999.0 %

Ordinary least square:

-99999.0 %


Temporal anomaly analyis

The variance of the temporal anomalies provides an additional measure about the stability of the signal AFTER removal of the mean seasonal cylce.

+000 deg


+057/+063 deg