LANGTANG


Location

lon / lat [deg]: 85.4925 / 28.0122

Source network: AERONET


Geostationary surface albedo (GSA) data


“+000”


“+057/+063”


Landcover information (based on ESA CCI landcover data)


Landcover fractions @ 2km distance


Landcover fractions @ 20 km distance


Legend


Distance to open water bodies [km]:

12.18

Distance to urban areas [km]:

26.98


Radius: 1 km

Number of landcover classes:

3

Dominant landcover type:

70: Tree cover, needleleaved, evergreen, closed to open (>15%)

Fraction of dominant landcover type [%]:

81.0


Radius: 2 km

Number of landcover classes:

3

Dominant landcover type:

70: Tree cover, needleleaved, evergreen, closed to open (>15%)

Fraction of dominant landcover type [%]:

80.0


Radius: 5 km

Number of landcover classes:

8

Dominant landcover type:

70: Tree cover, needleleaved, evergreen, closed to open (>15%)

Fraction of dominant landcover type [%]:

56.0


Radius: 10 km

Number of landcover classes:

8

Dominant landcover type:

70: Tree cover, needleleaved, evergreen, closed to open (>15%)

Fraction of dominant landcover type [%]:

42.0


Radius: 20 km

Number of landcover classes:

11

Dominant landcover type:

70: Tree cover, needleleaved, evergreen, closed to open (>15%)

Fraction of dominant landcover type [%]:

38.0


Disturbances


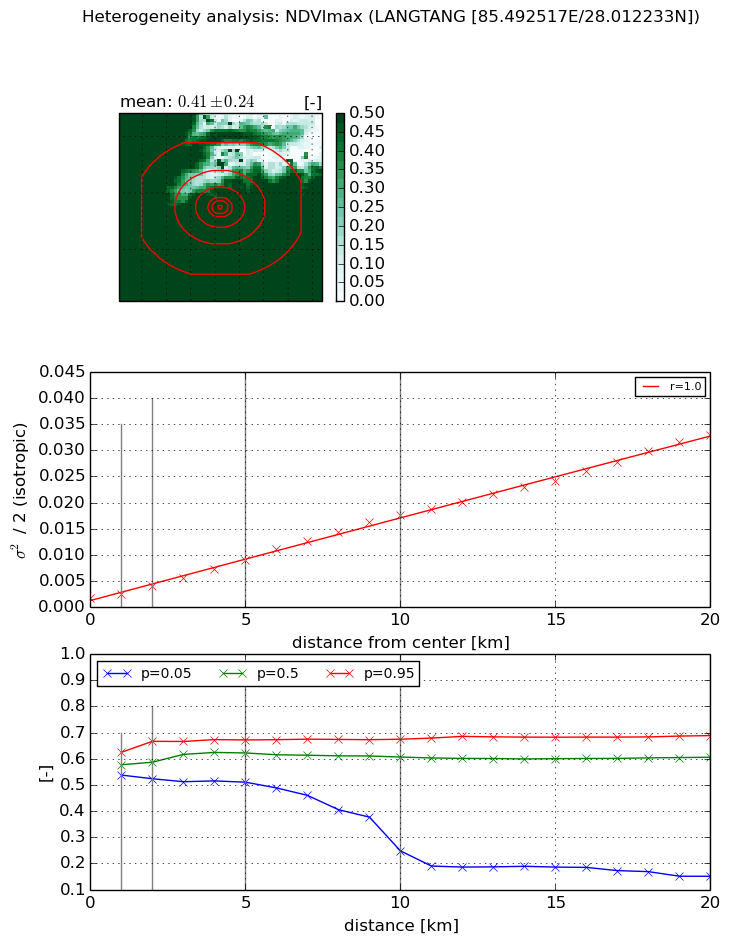
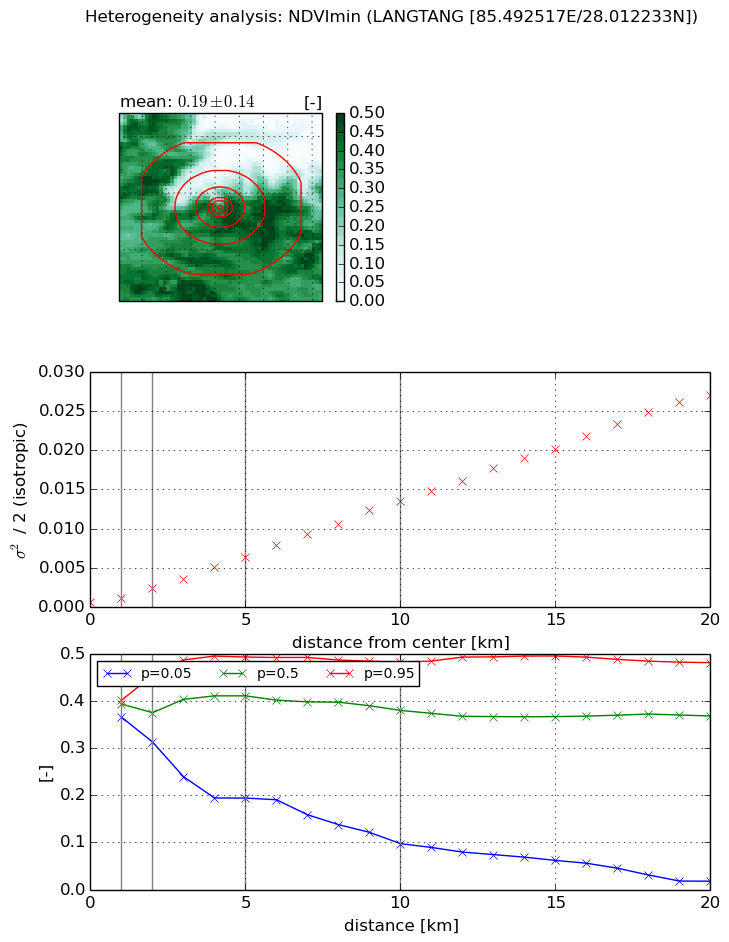
Heterogeneity analysis

The heterogeneity analysis provides information about the spatial and temporal heterogeneity of the site.

Topography


Roman et al. (2009) index


St

1.96460171822

Rcv

0.645310253033

Rse

0.0

Rst

-0.0429779007957

Rsv

0.838738913374


Height range @ 1km [m]

510

Height range @ 2km [m]

900

Height range @ 5km [m]

1958

Height range @ 10km [m]

-999

Height range @ 20km [m]

-999


Variance slope @ 1 km

68917

Variance slope @ 2 km

86469

Variance slope @ 5 km

92396

Variance slope @ 10 km

-999

Variance slope @ 20 km

-999


NDVI (max. NDVI composite)


Roman et al. (2009) index


St

0.563670454942

Rcv

0.0814561081614

Rse

0.0

Rst

-0.663942888638

Rsv

4.5768597338


NDVI range @ 1km [-]

0.09

NDVI range @ 2km [-]

0.14

NDVI range @ 5km [-]

0.16

NDVI range @ 10km [-]

0.43

NDVI range @ 20km [-]

0.54


Variance slope @ 1 km

0.000759107412162

Variance slope @ 2 km

0.00113485241479

Variance slope @ 5 km

0.00149449775704

Variance slope @ 10 km

0.0016614350453

Variance slope @ 20 km

0.00157375123284


NDVI (min. NDVI composite)I


Roman et al. (2009) index


St

1.98439045511

Rcv

0.194704181586

Rse

0.0

Rst

-0.163646537119

Rsv

1.15344853042


NDVI range @ 1km [-]

0.04

NDVI range @ 2km [-]

0.14

NDVI range @ 5km [-]

0.3

NDVI range @ 10km [-]

0.39

NDVI range @ 20km [-]

0.46


NDVI slope @ 1 km

0.000574194332076

NDVI slope @ 2 km

0.000879209845473

NDVI slope @ 5 km

0.00118965849983

NDVI slope @ 10 km

0.0013464597444

NDVI slope @ 20 km

0.00137514976798


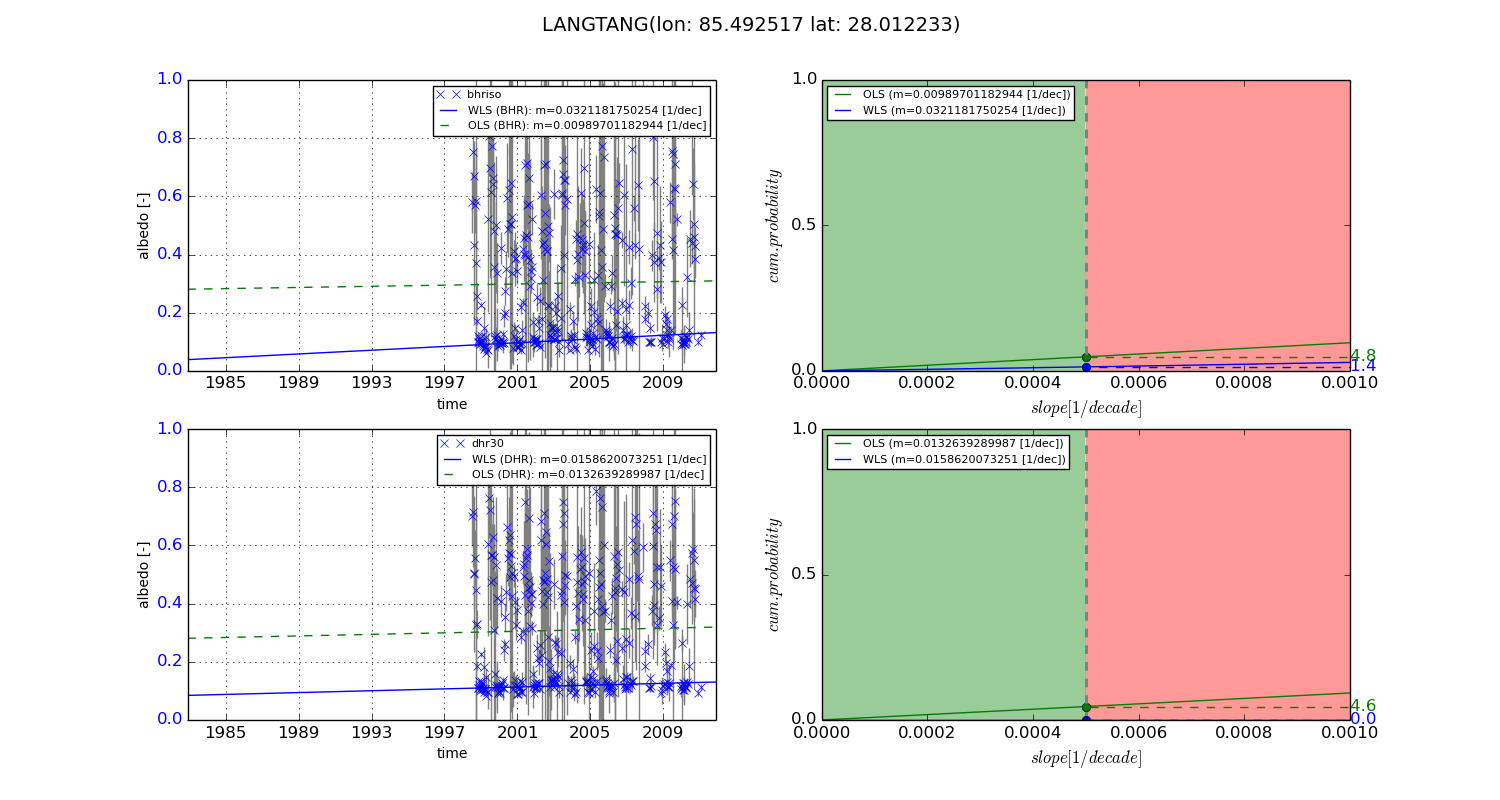
Temporal stability analysis

+000 deg (BHR)


BHR statistics

Temporal stability [1/decade]:


abs

rel


Weighted least square:

None


Ordinary least square:

None


Probabilities that GCOS criteria is met:

Weighted least square:

None %

Ordinary least square:

None %


DHR statistics

Temporal stability [1/decade]:


abs

rel


Weighted least square:

None


Ordinary least square:

None


Probabilities that GCOS criteria is met:

Weighted least square:

None %

Ordinary least square:

None %


+057/+063 deg (BHR)


BHR statistics

Temporal stability [1/decade]:


abs

rel


Weighted least square:

0.0321181750254


Ordinary least square:

0.00989701182944


Probabilities that GCOS criteria is met:

Weighted least square:

1.4 %

Ordinary least square:

4.8 %


DHR statistics

Temporal stability [1/decade]:


abs

rel


Weighted least square:

0.0158620073251


Ordinary least square:

0.0132639289987


Probabilities that GCOS criteria is met:

Weighted least square:

0.0 %

Ordinary least square:

4.6 %


Temporal anomaly analyis

The variance of the temporal anomalies provides an additional measure about the stability of the signal AFTER removal of the mean seasonal cylce.

+000 deg


+057/+063 deg