LAQUILA_COPPITO


Location

lon / lat [deg]: 13.3506 / 42.3684

Source network: AERONET


Geostationary surface albedo (GSA) data


“+000”


“+057/+063”


Landcover information (based on ESA CCI landcover data)


Landcover fractions @ 2km distance


Landcover fractions @ 20 km distance


Legend


Distance to open water bodies [km]:

15.76

Distance to urban areas [km]:

0.07


Radius: 1 km

Number of landcover classes:

2

Dominant landcover type:

190: urban areas

Fraction of dominant landcover type [%]:

71.0


Radius: 2 km

Number of landcover classes:

4

Dominant landcover type:

190: urban areas

Fraction of dominant landcover type [%]:

63.0


Radius: 5 km

Number of landcover classes:

7

Dominant landcover type:

10: cropland, rainfed

Fraction of dominant landcover type [%]:

38.0


Radius: 10 km

Number of landcover classes:

8

Dominant landcover type:

10: cropland, rainfed

Fraction of dominant landcover type [%]:

47.0


Radius: 20 km

Number of landcover classes:

10

Dominant landcover type:

10: cropland, rainfed

Fraction of dominant landcover type [%]:

38.0


Disturbances


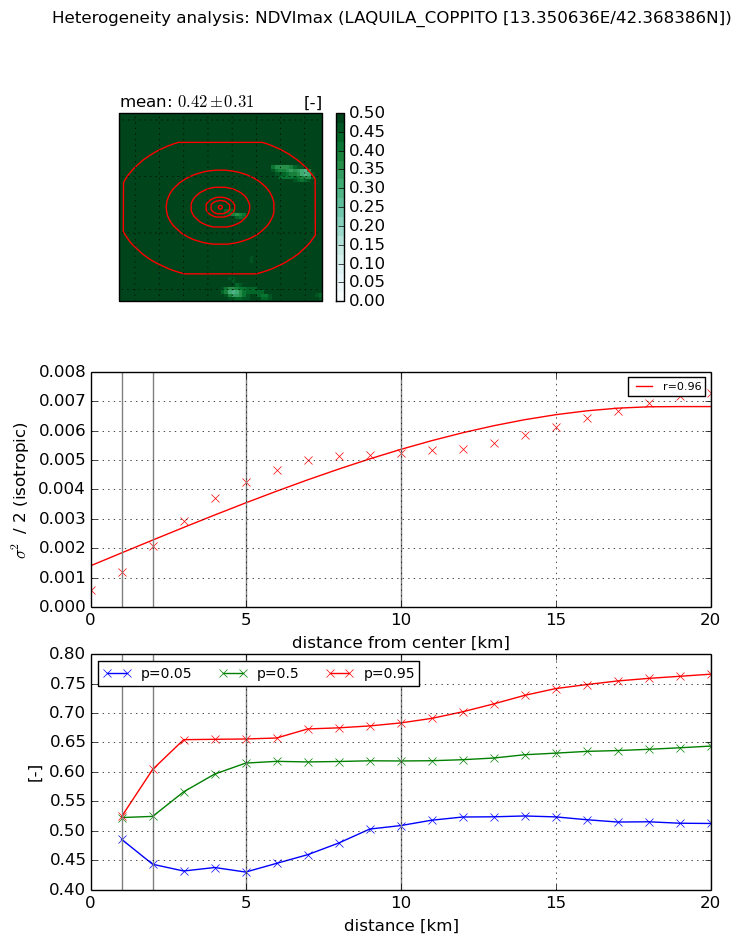
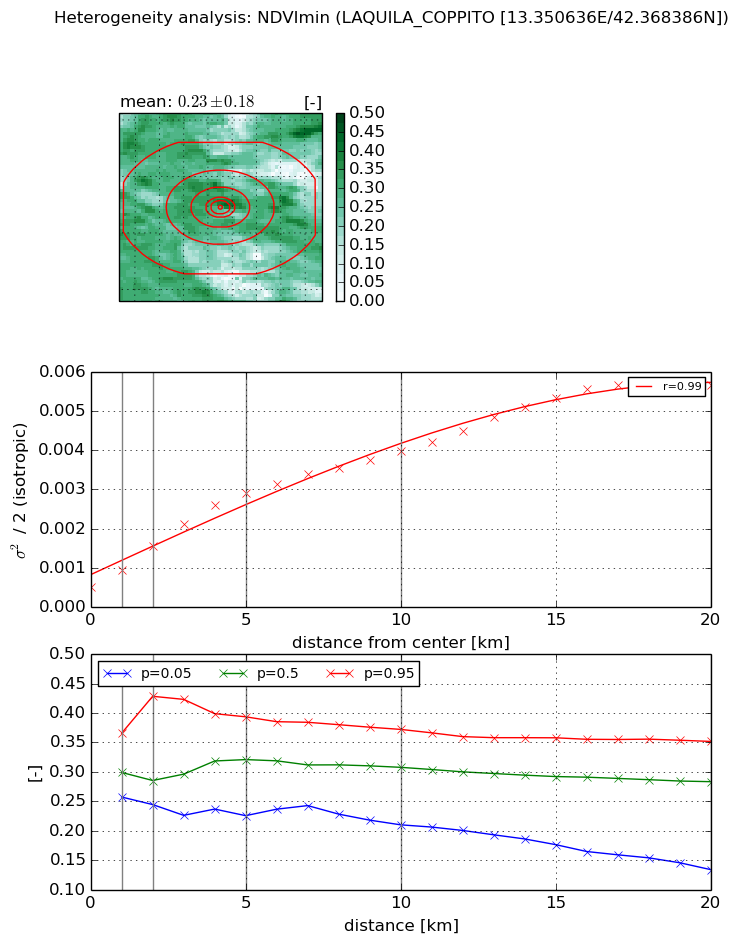
Heterogeneity analysis

The heterogeneity analysis provides information about the spatial and temporal heterogeneity of the site.

Topography


Roman et al. (2009) index


St

10.921894902

Rcv

0.114981786305

Rse

0.0

Rst

-0.000637485340992

Rsv

0.159058339422


Height range @ 1km [m]

59

Height range @ 2km [m]

237

Height range @ 5km [m]

468

Height range @ 10km [m]

-999

Height range @ 20km [m]

-999


Variance slope @ 1 km

4903

Variance slope @ 2 km

5364

Variance slope @ 5 km

6274

Variance slope @ 10 km

-999

Variance slope @ 20 km

-999


NDVI (max. NDVI composite)


Roman et al. (2009) index


St

42.7758167631

Rcv

-0.0340451958737

Rse

0.0

Rst

-0.0247841615668

Rsv

0.0113037277234


NDVI range @ 1km [-]

0.04

NDVI range @ 2km [-]

0.16

NDVI range @ 5km [-]

0.23

NDVI range @ 10km [-]

0.17

NDVI range @ 20km [-]

0.25


Variance slope @ 1 km

0.000609708697927

Variance slope @ 2 km

0.000752079853263

Variance slope @ 5 km

0.000763087435133

Variance slope @ 10 km

0.000487567838003

Variance slope @ 20 km

0.000284338419869


NDVI (min. NDVI composite)I


Roman et al. (2009) index


St

5.1986023428

Rcv

-0.234434057433

Rse

0.0

Rst

0.0250879403006

Rsv

-0.317556186397


NDVI range @ 1km [-]

0.11

NDVI range @ 2km [-]

0.18

NDVI range @ 5km [-]

0.17

NDVI range @ 10km [-]

0.16

NDVI range @ 20km [-]

0.22


NDVI slope @ 1 km

0.000438779178752

NDVI slope @ 2 km

0.000524272847594

NDVI slope @ 5 km

0.00049745351985

NDVI slope @ 10 km

0.000342154814233

NDVI slope @ 20 km

0.000255400769233


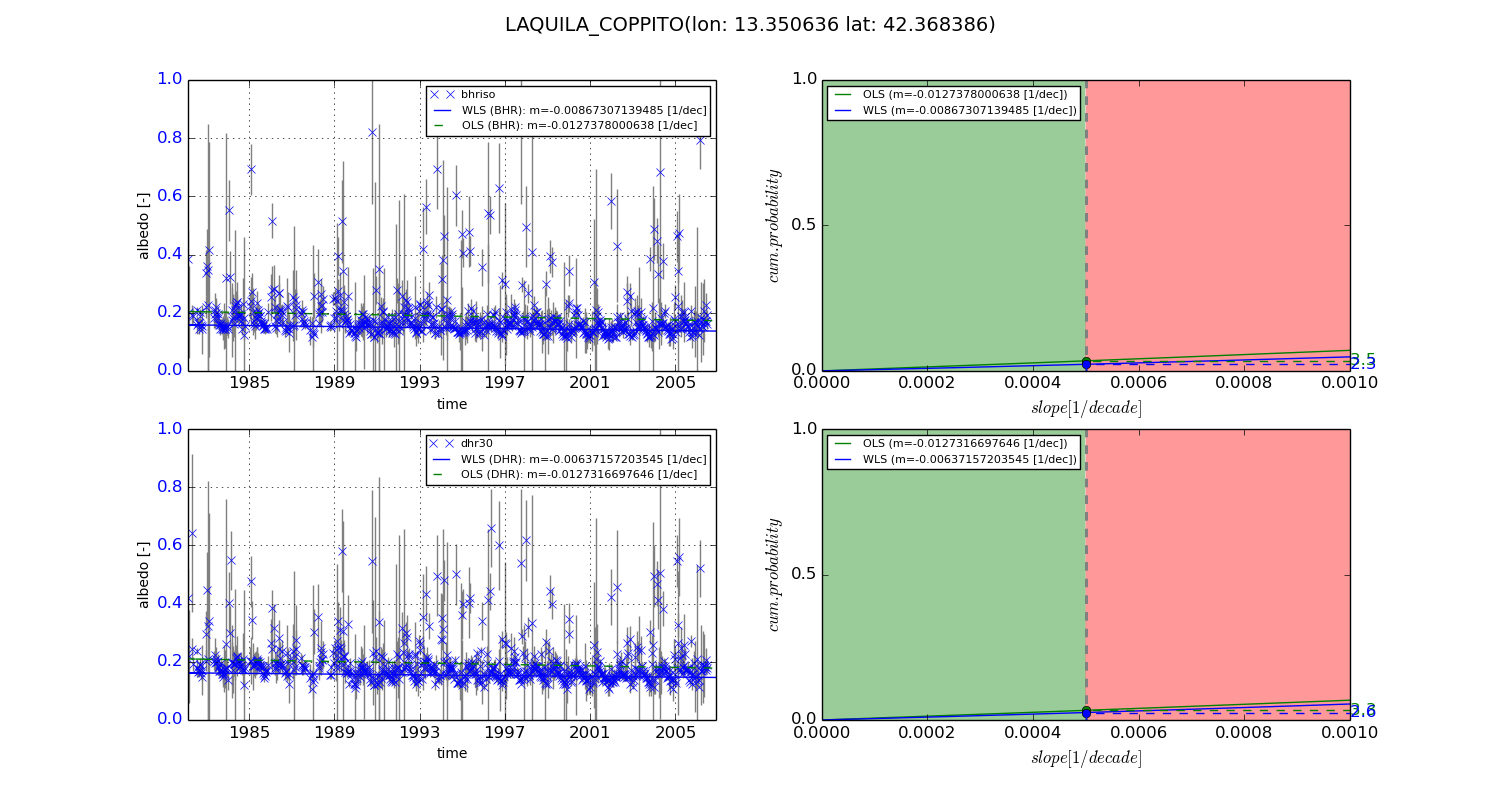
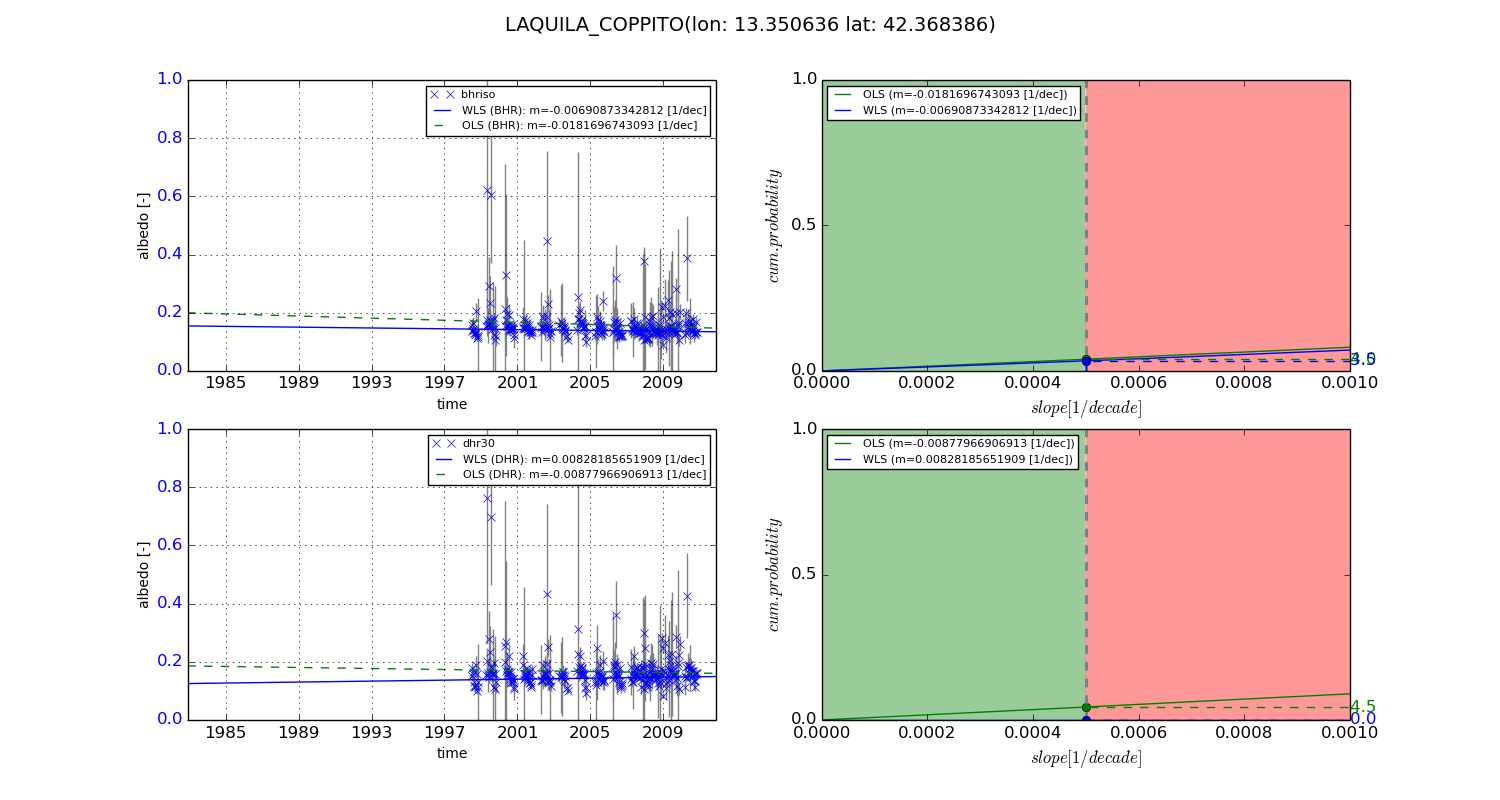
Temporal stability analysis

+000 deg (BHR)


BHR statistics

Temporal stability [1/decade]:


abs

rel


Weighted least square:

-0.00867307139485


Ordinary least square:

-0.0127378000638


Probabilities that GCOS criteria is met:

Weighted least square:

2.3 %

Ordinary least square:

3.5 %


DHR statistics

Temporal stability [1/decade]:


abs

rel


Weighted least square:

-0.00637157203545


Ordinary least square:

-0.0127316697646


Probabilities that GCOS criteria is met:

Weighted least square:

2.6 %

Ordinary least square:

3.3 %


+057/+063 deg (BHR)


BHR statistics

Temporal stability [1/decade]:


abs

rel


Weighted least square:

-0.00690873342812


Ordinary least square:

-0.0181696743093


Probabilities that GCOS criteria is met:

Weighted least square:

3.5 %

Ordinary least square:

4.0 %


DHR statistics

Temporal stability [1/decade]:


abs

rel


Weighted least square:

0.00828185651909


Ordinary least square:

-0.00877966906913


Probabilities that GCOS criteria is met:

Weighted least square:

0.0 %

Ordinary least square:

4.5 %


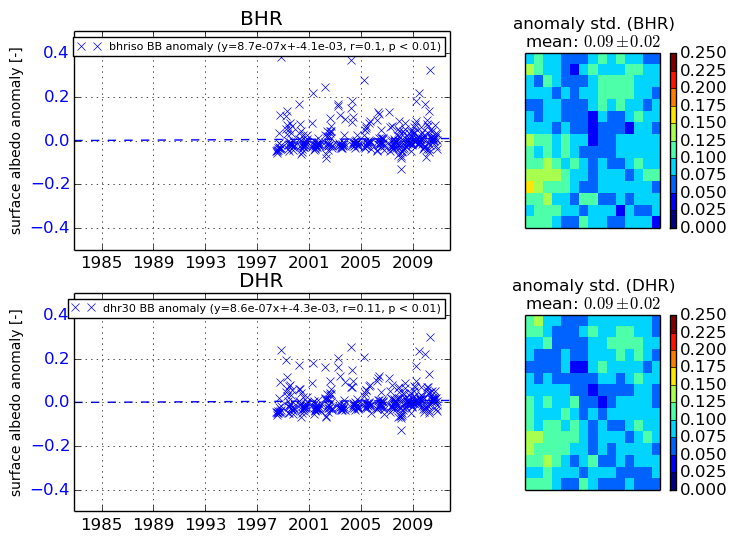
Temporal anomaly analyis

The variance of the temporal anomalies provides an additional measure about the stability of the signal AFTER removal of the mean seasonal cylce.
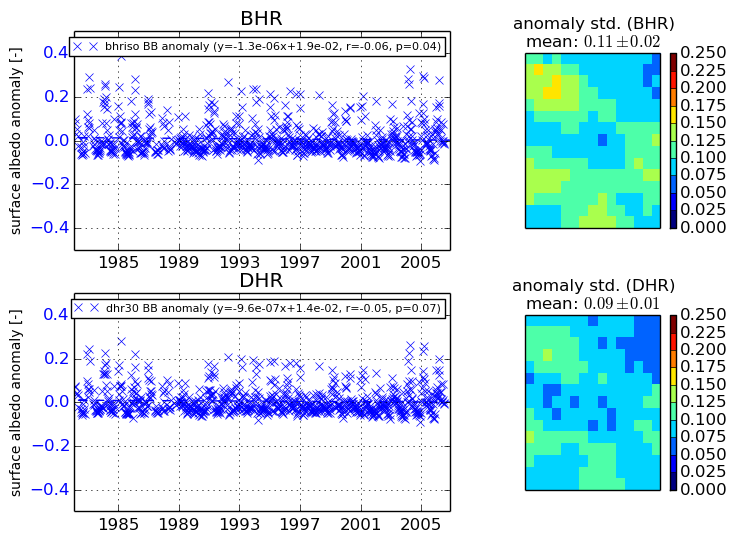
+000 deg


+057/+063 deg