LAQUILA_GRANSASSO


Location

lon / lat [deg]: 13.5504 / 42.4479

Source network: AERONET


Geostationary surface albedo (GSA) data


“+000”


“+057/+063”


Landcover information (based on ESA CCI landcover data)


Landcover fractions @ 2km distance


Landcover fractions @ 20 km distance


Legend


Distance to open water bodies [km]:

13.57

Distance to urban areas [km]:

3.96


Radius: 1 km

Number of landcover classes:

3

Dominant landcover type:

150: Sparse vegetation (tree, shrub, herbaceous cover) (<15%)

Fraction of dominant landcover type [%]:

77.0


Radius: 2 km

Number of landcover classes:

4

Dominant landcover type:

150: Sparse vegetation (tree, shrub, herbaceous cover) (<15%)

Fraction of dominant landcover type [%]:

61.0


Radius: 5 km

Number of landcover classes:

8

Dominant landcover type:

150: Sparse vegetation (tree, shrub, herbaceous cover) (<15%)

Fraction of dominant landcover type [%]:

40.0


Radius: 10 km

Number of landcover classes:

9

Dominant landcover type:

10: cropland, rainfed

Fraction of dominant landcover type [%]:

30.0


Radius: 20 km

Number of landcover classes:

10

Dominant landcover type:

10: cropland, rainfed

Fraction of dominant landcover type [%]:

35.0


Disturbances


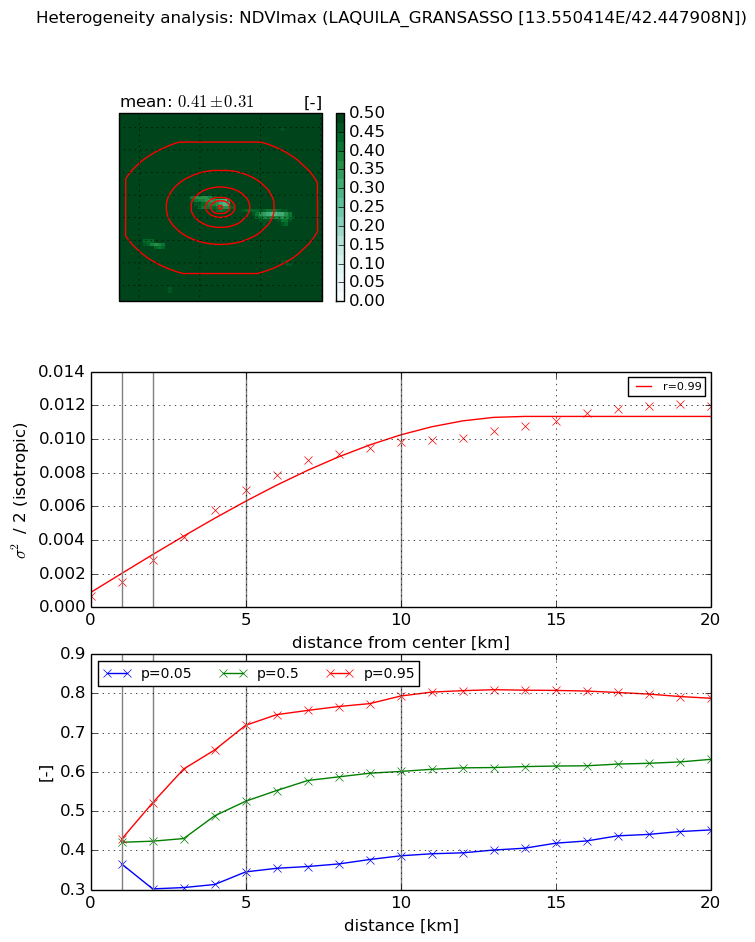
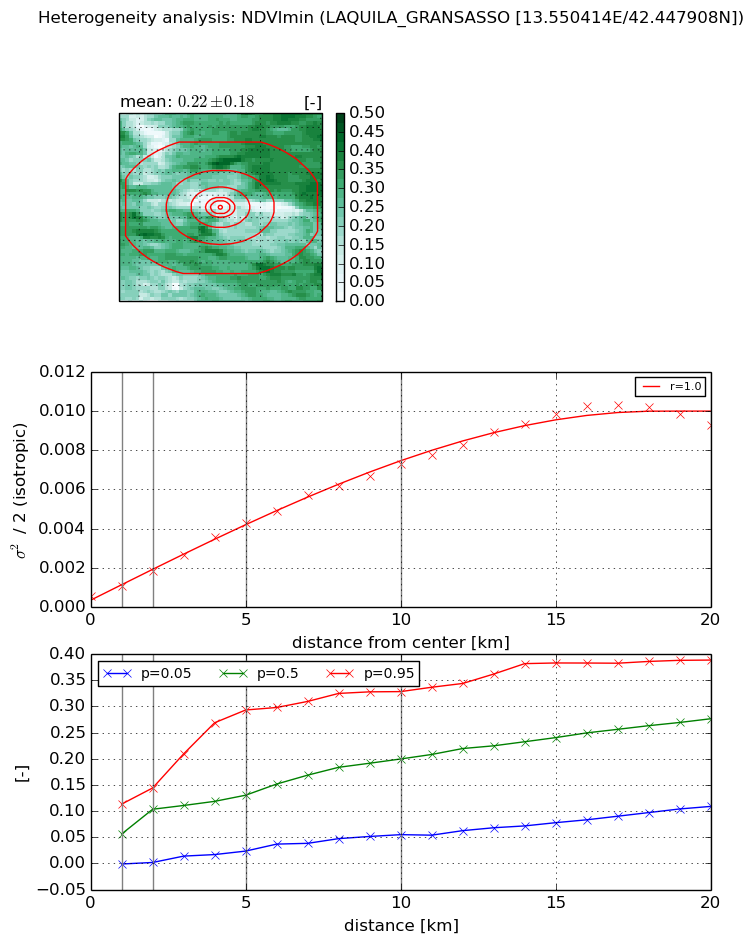
Heterogeneity analysis

The heterogeneity analysis provides information about the spatial and temporal heterogeneity of the site.

Topography


Roman et al. (2009) index


St

1.51965055227e-17

Rcv

0.37733262931

Rse

0.0

Rst

0.0443279592453

Rsv

1.97413806451e+17


Height range @ 1km [m]

401

Height range @ 2km [m]

737

Height range @ 5km [m]

1325

Height range @ 10km [m]

-999

Height range @ 20km [m]

-999


Variance slope @ 1 km

38724

Variance slope @ 2 km

50702

Variance slope @ 5 km

48585

Variance slope @ 10 km

-999

Variance slope @ 20 km

-999


NDVI (max. NDVI composite)


Roman et al. (2009) index


St

5.89177127602

Rcv

0.0896718445031

Rse

0.0

Rst

0.168880953182

Rsv

-0.250631938018


NDVI range @ 1km [-]

0.06

NDVI range @ 2km [-]

0.22

NDVI range @ 5km [-]

0.37

NDVI range @ 10km [-]

0.41

NDVI range @ 20km [-]

0.34


Variance slope @ 1 km

0.000791412518444

Variance slope @ 2 km

0.00105337590855

Variance slope @ 5 km

0.00130555935552

Variance slope @ 10 km

0.000979065281704

Variance slope @ 20 km

0.000530884864492


NDVI (min. NDVI composite)I


Roman et al. (2009) index


St

4.2331685566

Rcv

0.0489529301089

Rse

0.0

Rst

-0.0661090466155

Rsv

0.593627025353


NDVI range @ 1km [-]

0.11

NDVI range @ 2km [-]

0.14

NDVI range @ 5km [-]

0.27

NDVI range @ 10km [-]

0.27

NDVI range @ 20km [-]

0.28


NDVI slope @ 1 km

0.000500434189239

NDVI slope @ 2 km

0.000639656492066

NDVI slope @ 5 km

0.00076798710051

NDVI slope @ 10 km

0.000698842873042

NDVI slope @ 20 km

0.000502850813123


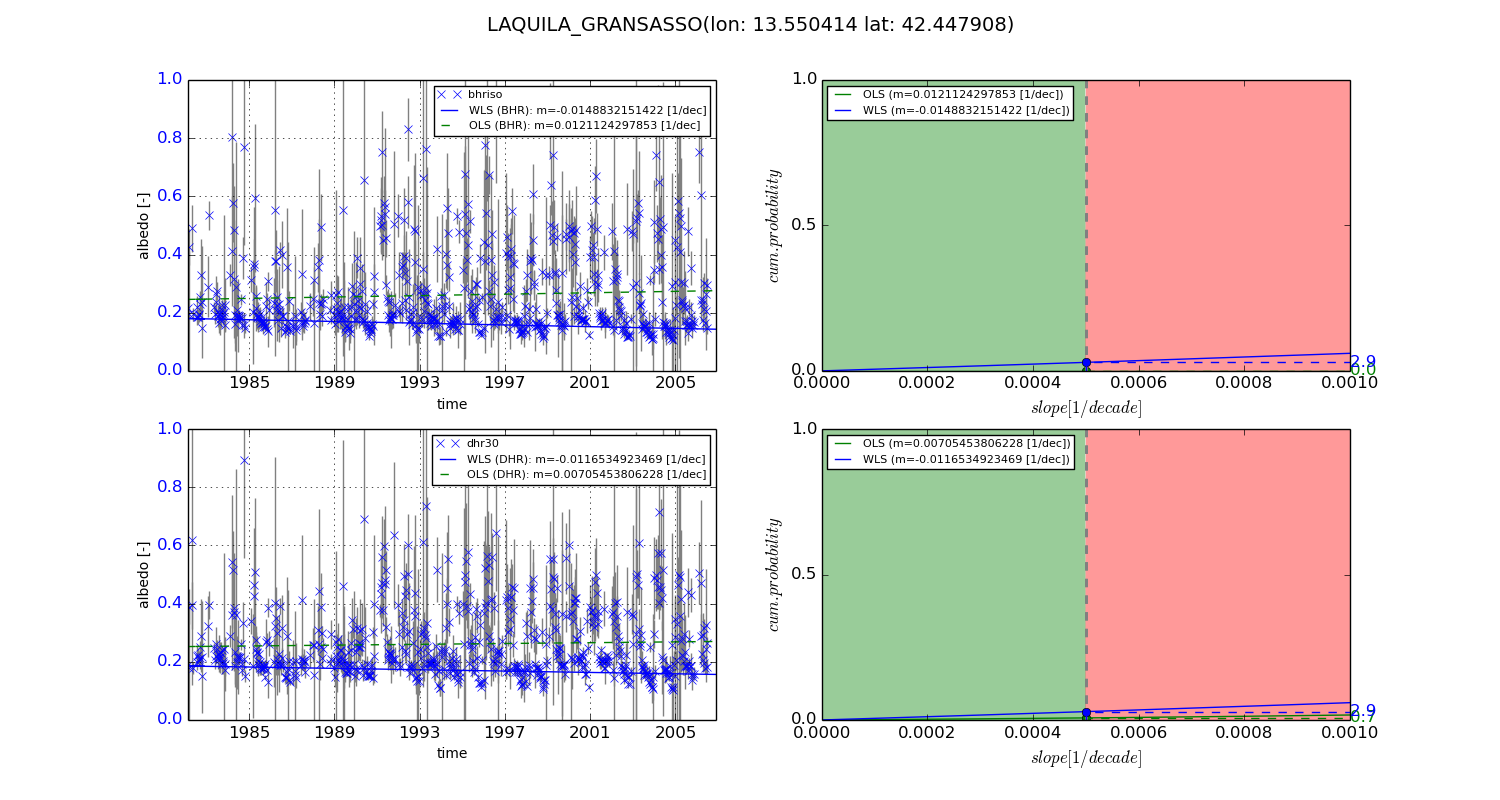
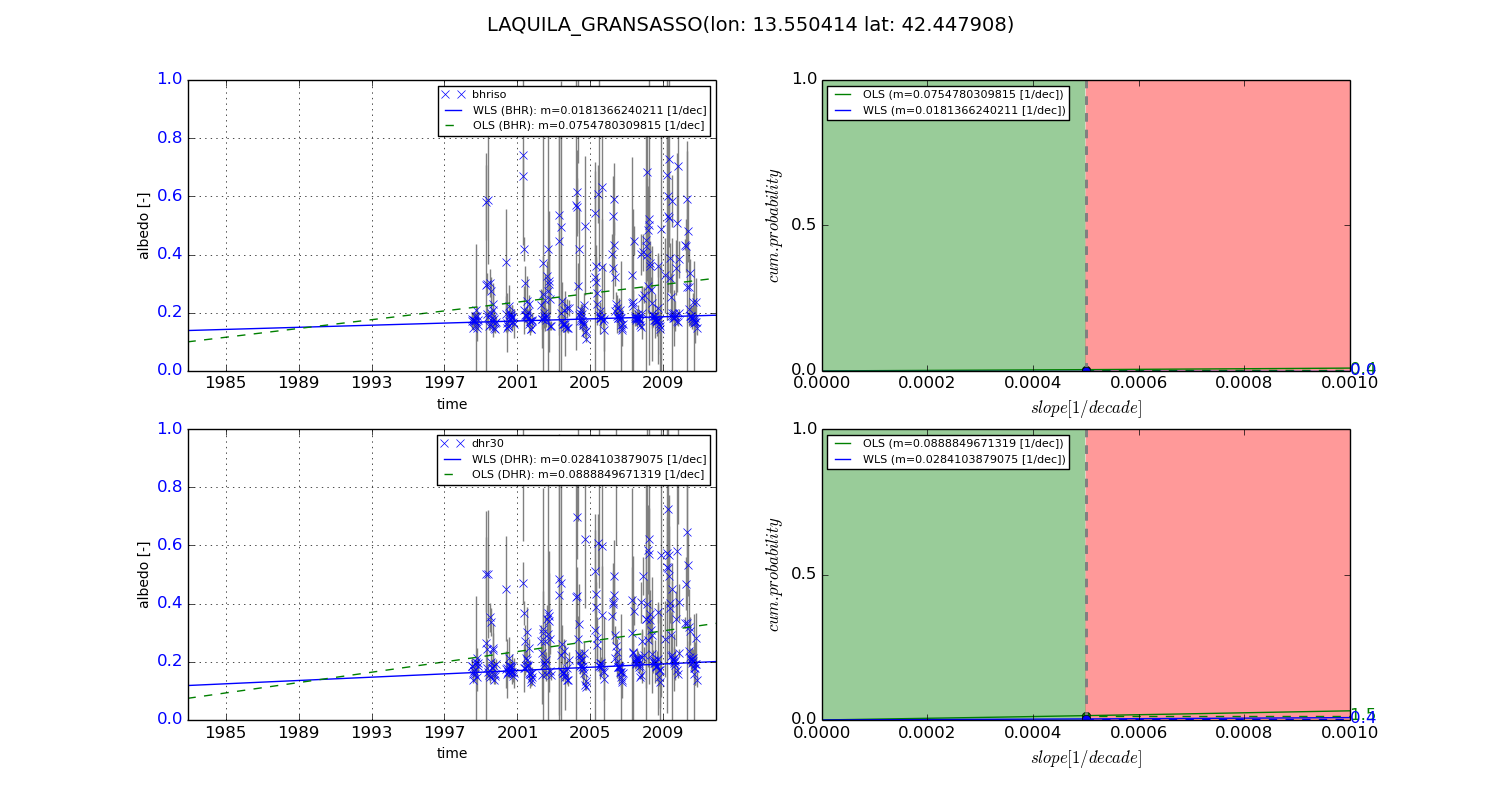
Temporal stability analysis

+000 deg (BHR)


BHR statistics

Temporal stability [1/decade]:


abs

rel


Weighted least square:

-0.0148832151422


Ordinary least square:

0.0121124297853


Probabilities that GCOS criteria is met:

Weighted least square:

2.9 %

Ordinary least square:

0.0 %


DHR statistics

Temporal stability [1/decade]:


abs

rel


Weighted least square:

-0.0116534923469


Ordinary least square:

0.00705453806228


Probabilities that GCOS criteria is met:

Weighted least square:

2.9 %

Ordinary least square:

0.7 %


+057/+063 deg (BHR)


BHR statistics

Temporal stability [1/decade]:


abs

rel


Weighted least square:

0.0181366240211


Ordinary least square:

0.0754780309815


Probabilities that GCOS criteria is met:

Weighted least square:

0.0 %

Ordinary least square:

0.4 %


DHR statistics

Temporal stability [1/decade]:


abs

rel


Weighted least square:

0.0284103879075


Ordinary least square:

0.0888849671319


Probabilities that GCOS criteria is met:

Weighted least square:

0.4 %

Ordinary least square:

1.5 %


Temporal anomaly analyis

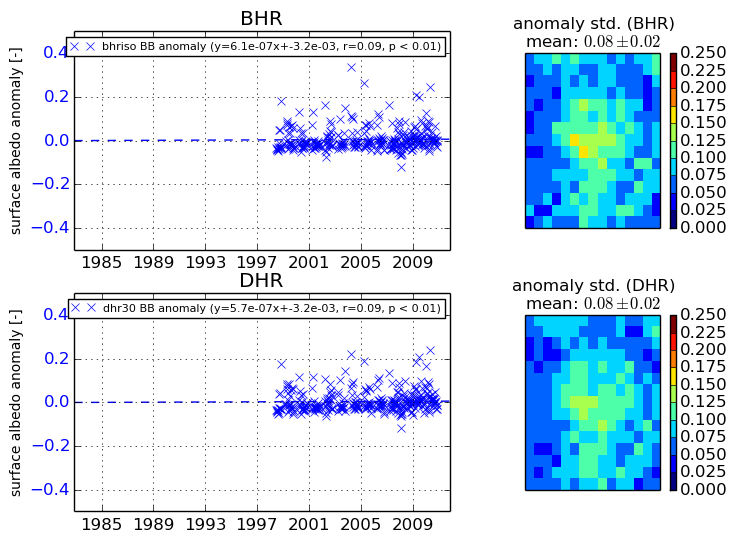
The variance of the temporal anomalies provides an additional measure about the stability of the signal AFTER removal of the mean seasonal cylce.
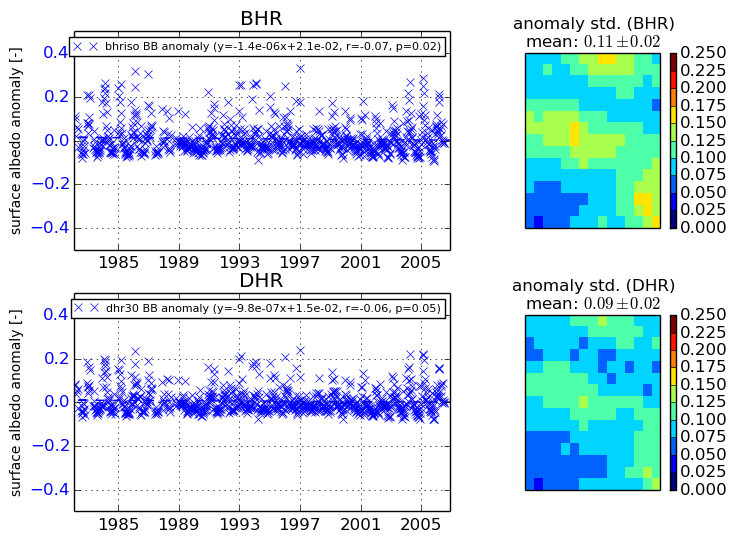
+000 deg


+057/+063 deg