LATOYA


Location

lon / lat [deg]: 23.2999 / -15.6781

Source network: AERONET


Geostationary surface albedo (GSA) data


“+000”


“+057/+063”


Landcover information (based on ESA CCI landcover data)


Landcover fractions @ 2km distance


Landcover fractions @ 20 km distance


Legend


Distance to open water bodies [km]:

5.62

Distance to urban areas [km]:

7.06


Radius: 1 km

Number of landcover classes:

2

Dominant landcover type:

120: Shrubland

Fraction of dominant landcover type [%]:

94.0


Radius: 2 km

Number of landcover classes:

5

Dominant landcover type:

120: Shrubland

Fraction of dominant landcover type [%]:

80.0


Radius: 5 km

Number of landcover classes:

6

Dominant landcover type:

120: Shrubland

Fraction of dominant landcover type [%]:

63.0


Radius: 10 km

Number of landcover classes:

7

Dominant landcover type:

120: Shrubland

Fraction of dominant landcover type [%]:

53.0


Radius: 20 km

Number of landcover classes:

9

Dominant landcover type:

120: Shrubland

Fraction of dominant landcover type [%]:

31.0


Disturbances


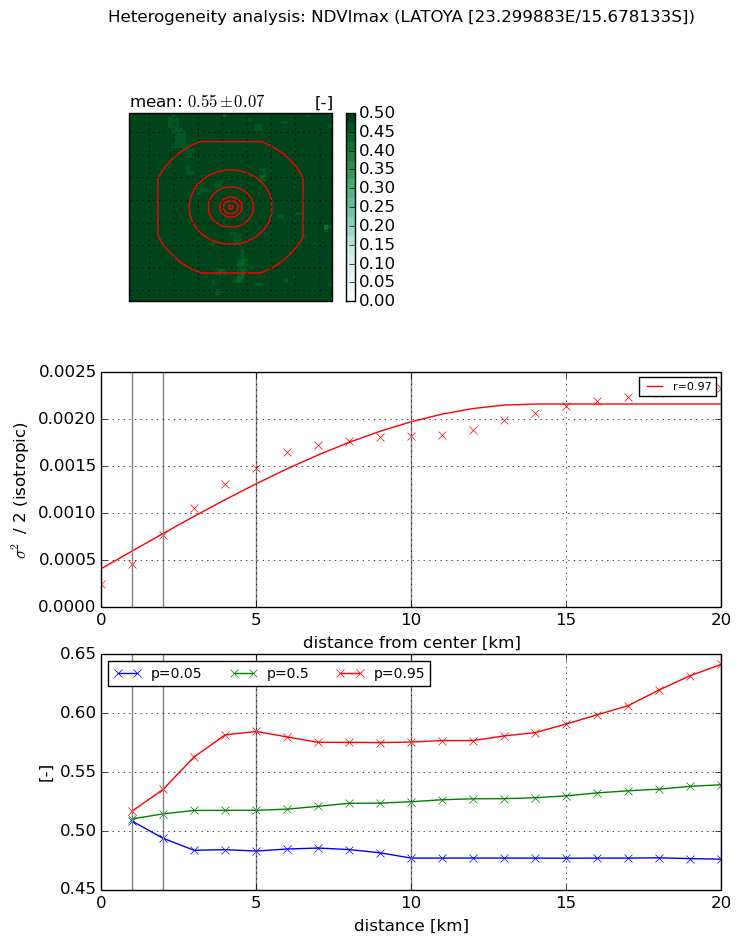
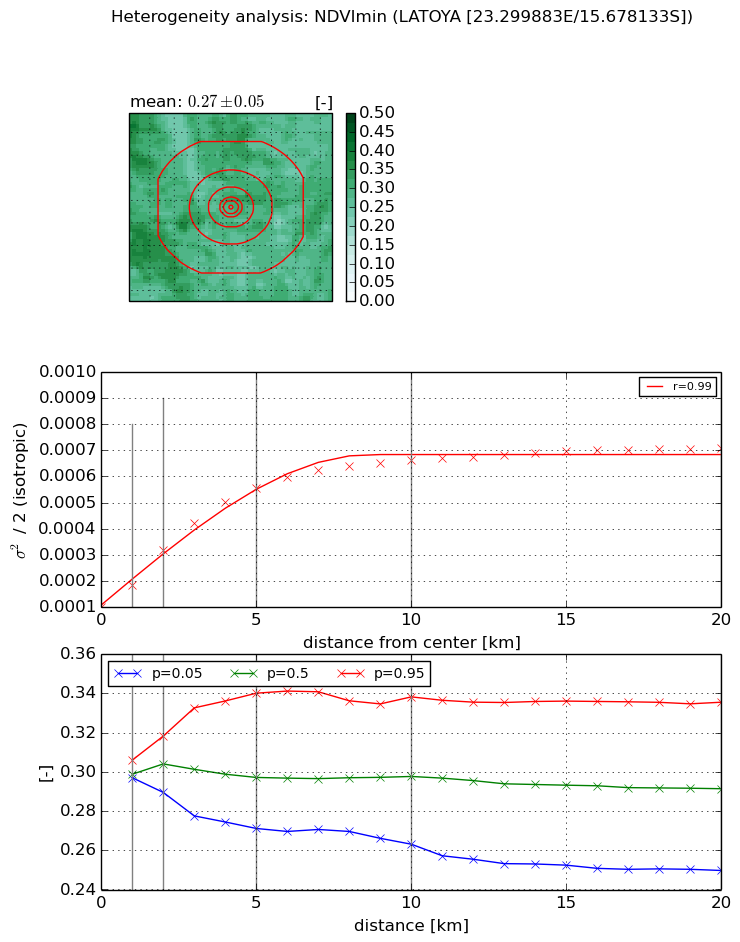
Heterogeneity analysis

The heterogeneity analysis provides information about the spatial and temporal heterogeneity of the site.

Topography


Roman et al. (2009) index


St

1.64443848321

Rcv

0.2674692937

Rse

0.0

Rst

-0.12148071604

Rsv

1.43538092792


Height range @ 1km [m]

18

Height range @ 2km [m]

32

Height range @ 5km [m]

41

Height range @ 10km [m]

-999

Height range @ 20km [m]

-999


Variance slope @ 1 km

45

Variance slope @ 2 km

49

Variance slope @ 5 km

38

Variance slope @ 10 km

-999

Variance slope @ 20 km

-999


NDVI (max. NDVI composite)


Roman et al. (2009) index


St

2.78650001546

Rcv

0.301250685559

Rse

0.0

Rst

0.0790869434784

Rsv

0.696281780024


NDVI range @ 1km [-]

0.01

NDVI range @ 2km [-]

0.04

NDVI range @ 5km [-]

0.1

NDVI range @ 10km [-]

0.1

NDVI range @ 20km [-]

0.17


Variance slope @ 1 km

0.000205048850423

Variance slope @ 2 km

0.000261188035492

Variance slope @ 5 km

0.000256505924121

Variance slope @ 10 km

0.000163039896382

Variance slope @ 20 km

8.95609142845e-05


NDVI (min. NDVI composite)I


Roman et al. (2009) index


St

4.87709091009

Rcv

0.247352000617

Rse

0.0

Rst

-0.09251139206

Rsv

0.275257394551


NDVI range @ 1km [-]

0.01

NDVI range @ 2km [-]

0.03

NDVI range @ 5km [-]

0.07

NDVI range @ 10km [-]

0.08

NDVI range @ 20km [-]

0.09


NDVI slope @ 1 km

8.46488463866e-05

NDVI slope @ 2 km

0.000108524194229

NDVI slope @ 5 km

9.50504653154e-05

NDVI slope @ 10 km

5.58411086698e-05

NDVI slope @ 20 km

2.38838113026e-05


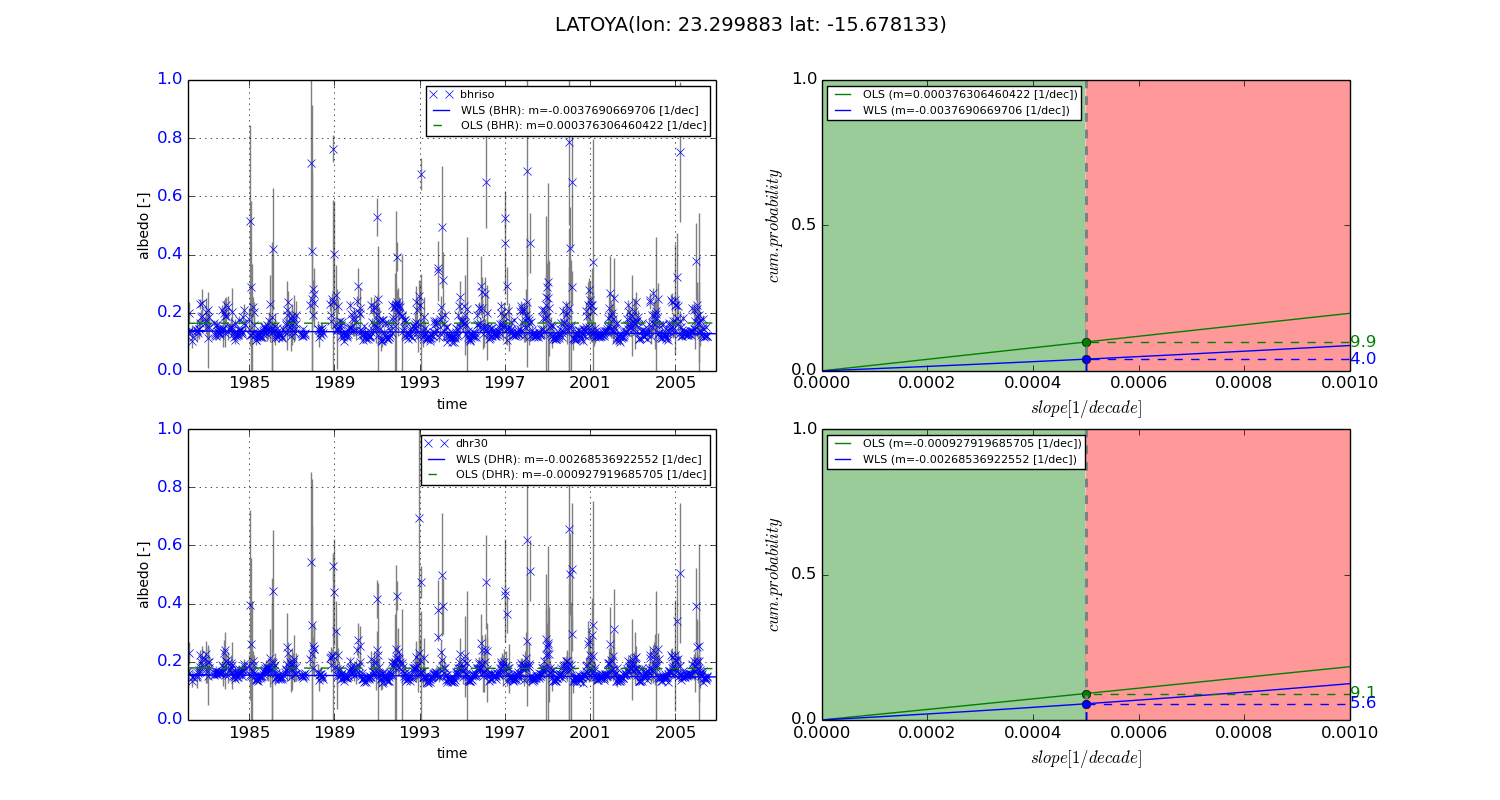
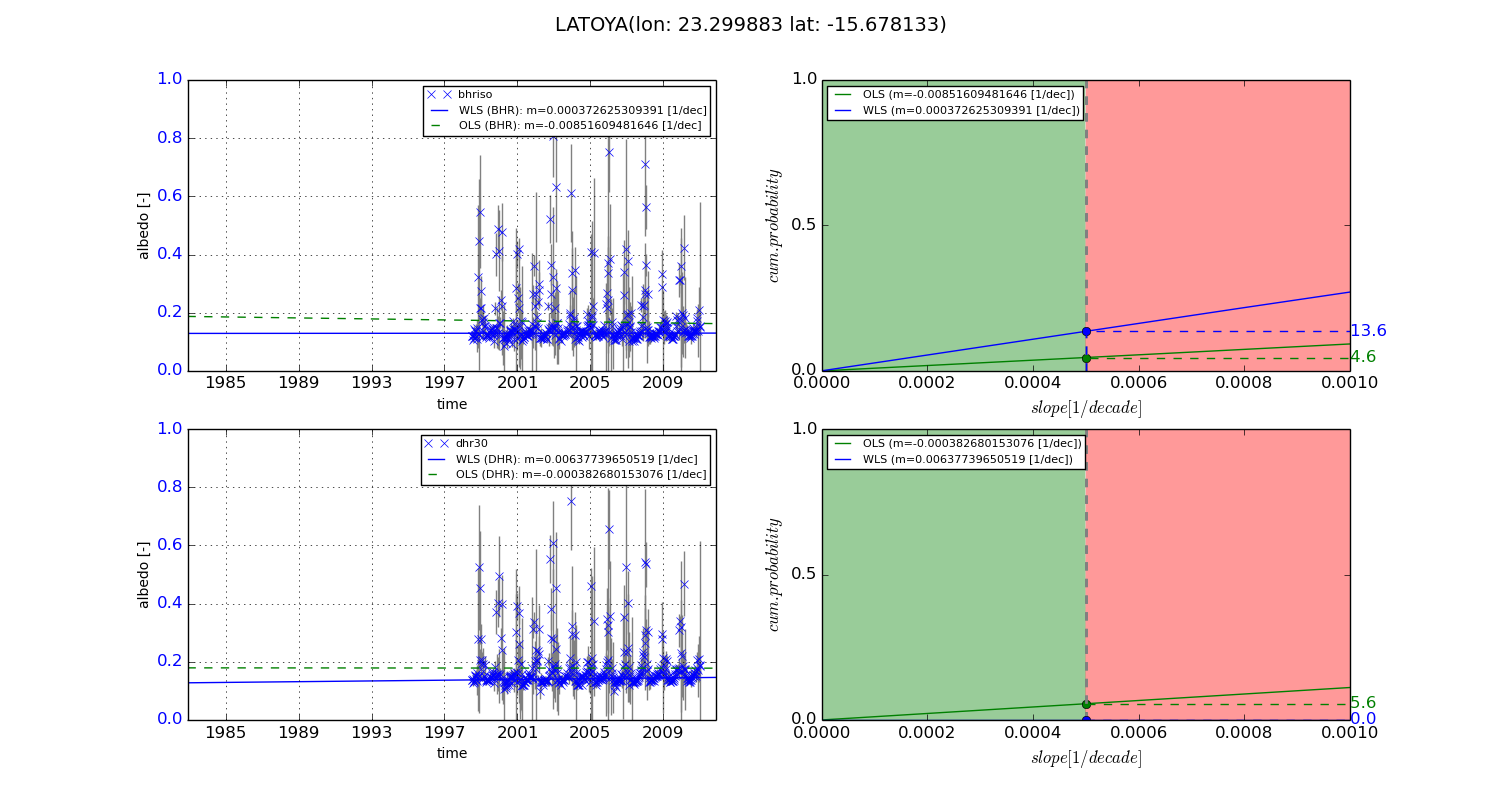
Temporal stability analysis

+000 deg (BHR)


BHR statistics

Temporal stability [1/decade]:


abs

rel


Weighted least square:

-0.0037690669706


Ordinary least square:

0.000376306460422


Probabilities that GCOS criteria is met:

Weighted least square:

4.0 %

Ordinary least square:

9.9 %


DHR statistics

Temporal stability [1/decade]:


abs

rel


Weighted least square:

-0.00268536922552


Ordinary least square:

-0.000927919685705


Probabilities that GCOS criteria is met:

Weighted least square:

5.6 %

Ordinary least square:

9.1 %


+057/+063 deg (BHR)


BHR statistics

Temporal stability [1/decade]:


abs

rel


Weighted least square:

0.000372625309391


Ordinary least square:

-0.00851609481646


Probabilities that GCOS criteria is met:

Weighted least square:

13.6 %

Ordinary least square:

4.6 %


DHR statistics

Temporal stability [1/decade]:


abs

rel


Weighted least square:

0.00637739650519


Ordinary least square:

-0.000382680153076


Probabilities that GCOS criteria is met:

Weighted least square:

0.0 %

Ordinary least square:

5.6 %


Temporal anomaly analyis

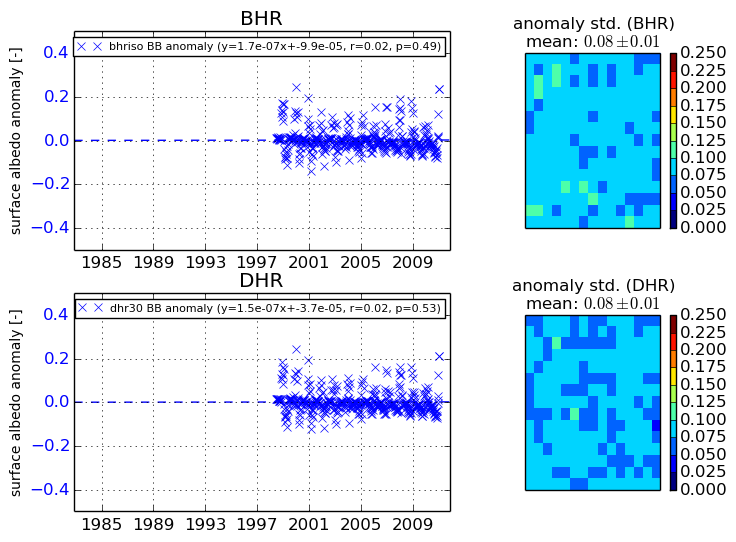
The variance of the temporal anomalies provides an additional measure about the stability of the signal AFTER removal of the mean seasonal cylce.
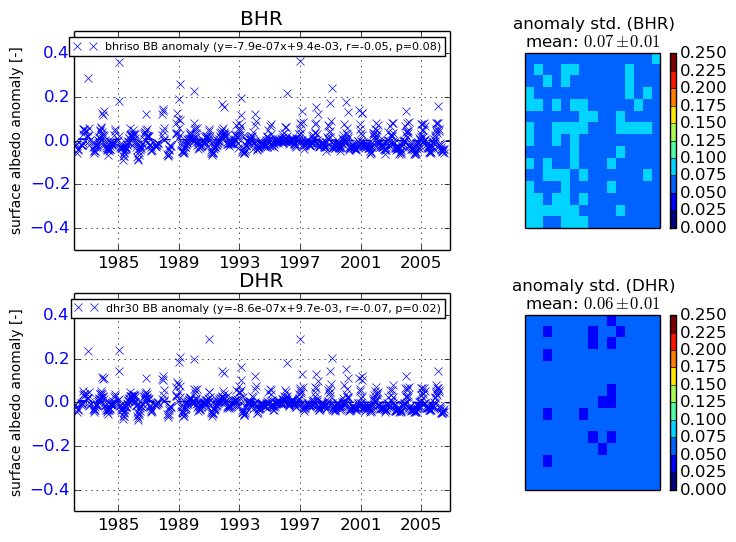
+000 deg


+057/+063 deg