LAU


Location

lon / lat [deg]: 169.689 / -45.045

Source network: BSRN


Geostationary surface albedo (GSA) data


“+000”


“+057/+063”


Landcover information (based on ESA CCI landcover data)


Landcover fractions @ 2km distance


Landcover fractions @ 20 km distance


Legend


Distance to open water bodies [km]:

21.91

Distance to urban areas [km]:

31.46


Radius: 1 km

Number of landcover classes:

3

Dominant landcover type:

10: cropland, rainfed

Fraction of dominant landcover type [%]:

74.0


Radius: 2 km

Number of landcover classes:

3

Dominant landcover type:

10: cropland, rainfed

Fraction of dominant landcover type [%]:

53.0


Radius: 5 km

Number of landcover classes:

4

Dominant landcover type:

10: cropland, rainfed

Fraction of dominant landcover type [%]:

56.0


Radius: 10 km

Number of landcover classes:

4

Dominant landcover type:

10: cropland, rainfed

Fraction of dominant landcover type [%]:

65.0


Radius: 20 km

Number of landcover classes:

4

Dominant landcover type:

130: grassland

Fraction of dominant landcover type [%]:

57.0


Disturbances


Heterogeneity analysis

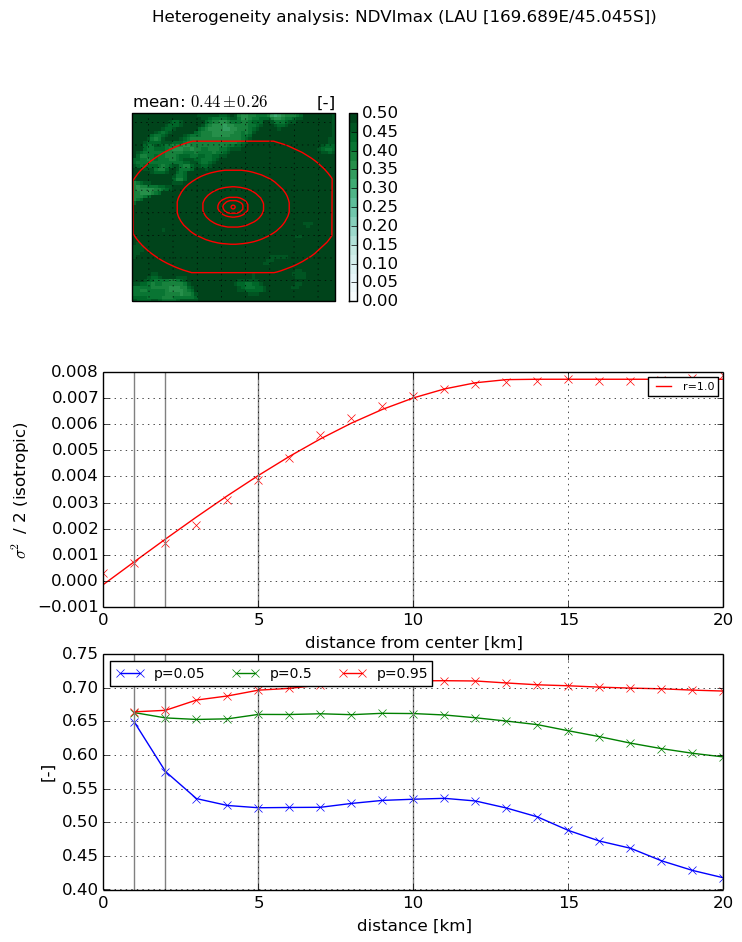
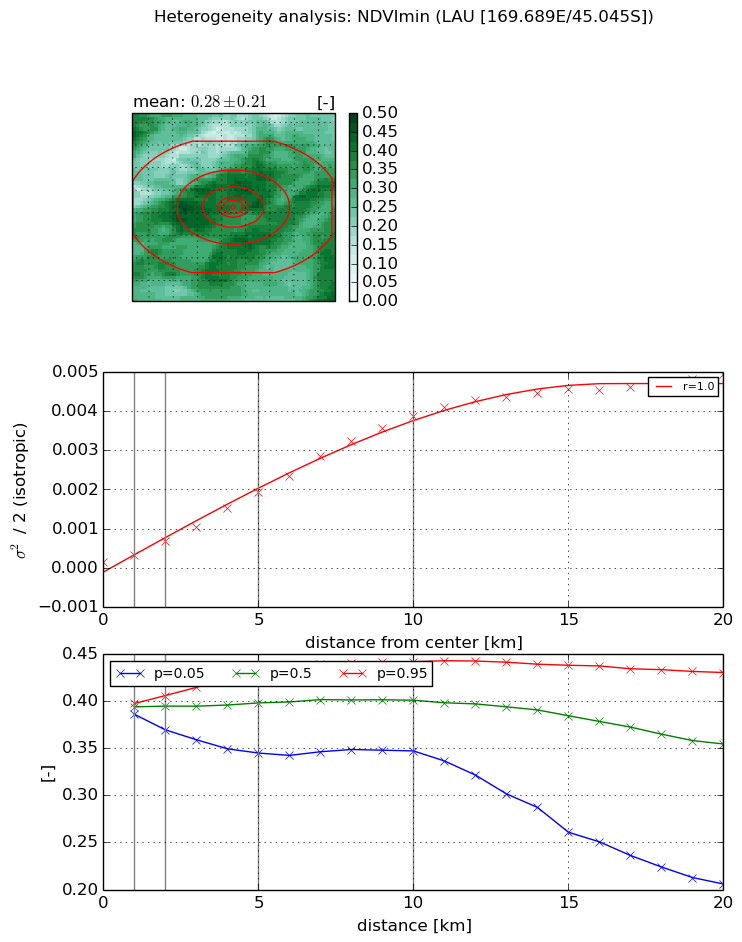
The heterogeneity analysis provides information about the spatial and temporal heterogeneity of the site.

Topography


Roman et al. (2009) index


St

5.00431547052

Rcv

0.405209941028

Rse

0.0

Rst

0.0516897978502

Rsv

-0.142582851232


Height range @ 1km [m]

30

Height range @ 2km [m]

72

Height range @ 5km [m]

177

Height range @ 10km [m]

-999

Height range @ 20km [m]

-999


Variance slope @ 1 km

641

Variance slope @ 2 km

770

Variance slope @ 5 km

740

Variance slope @ 10 km

-999

Variance slope @ 20 km

-999


NDVI (max. NDVI composite)


Roman et al. (2009) index


St

4.66121052093e-06

Rcv

0.172951771586

Rse

0.0

Rst

0.158105735101

Rsv

643609.303507


NDVI range @ 1km [-]

0.02

NDVI range @ 2km [-]

0.09

NDVI range @ 5km [-]

0.17

NDVI range @ 10km [-]

0.18

NDVI range @ 20km [-]

0.28


Variance slope @ 1 km

0.000397499934678

Variance slope @ 2 km

0.000580167764531

Variance slope @ 5 km

0.000740280364696

Variance slope @ 10 km

0.000734812882954

Variance slope @ 20 km

0.000383614554011


NDVI (min. NDVI composite)I


Roman et al. (2009) index


St

1.10813984619e-07

Rcv

0.427604968847

Rse

0.0

Rst

0.0943471370243

Rsv

27072394.8108


NDVI range @ 1km [-]

0.01

NDVI range @ 2km [-]

0.04

NDVI range @ 5km [-]

0.09

NDVI range @ 10km [-]

0.09

NDVI range @ 20km [-]

0.22


NDVI slope @ 1 km

0.000184502105221

NDVI slope @ 2 km

0.000272984717938

NDVI slope @ 5 km

0.000366259150689

NDVI slope @ 10 km

0.000397416020537

NDVI slope @ 20 km

0.000249326427764


Temporal stability analysis

+000 deg (BHR)


BHR statistics

Temporal stability [1/decade]:


abs

rel


Weighted least square:

None


Ordinary least square:

None


Probabilities that GCOS criteria is met:

Weighted least square:

None %

Ordinary least square:

None %


DHR statistics

Temporal stability [1/decade]:


abs

rel


Weighted least square:

None


Ordinary least square:

None


Probabilities that GCOS criteria is met:

Weighted least square:

None %

Ordinary least square:

None %


+057/+063 deg (BHR)


BHR statistics

Temporal stability [1/decade]:


abs

rel


Weighted least square:

None


Ordinary least square:

None


Probabilities that GCOS criteria is met:

Weighted least square:

None %

Ordinary least square:

None %


DHR statistics

Temporal stability [1/decade]:


abs

rel


Weighted least square:

None


Ordinary least square:

None


Probabilities that GCOS criteria is met:

Weighted least square:

None %

Ordinary least square:

None %


Temporal anomaly analyis

The variance of the temporal anomalies provides an additional measure about the stability of the signal AFTER removal of the mean seasonal cylce.

+000 deg


+057/+063 deg