LEICESTER


Location

lon / lat [deg]: -1.1223 / 52.6193

Source network: AERONET


Geostationary surface albedo (GSA) data


“+000”


“+057/+063”


Landcover information (based on ESA CCI landcover data)


Landcover fractions @ 2km distance


Landcover fractions @ 20 km distance


Legend


Distance to open water bodies [km]:

9.42

Distance to urban areas [km]:

0.16


Radius: 1 km

Number of landcover classes:

1

Dominant landcover type:

190: urban areas

Fraction of dominant landcover type [%]:

100.0


Radius: 2 km

Number of landcover classes:

1

Dominant landcover type:

190: urban areas

Fraction of dominant landcover type [%]:

100.0


Radius: 5 km

Number of landcover classes:

3

Dominant landcover type:

190: urban areas

Fraction of dominant landcover type [%]:

95.0


Radius: 10 km

Number of landcover classes:

3

Dominant landcover type:

190: urban areas

Fraction of dominant landcover type [%]:

50.0


Radius: 20 km

Number of landcover classes:

3

Dominant landcover type:

10: cropland, rainfed

Fraction of dominant landcover type [%]:

45.0


Disturbances


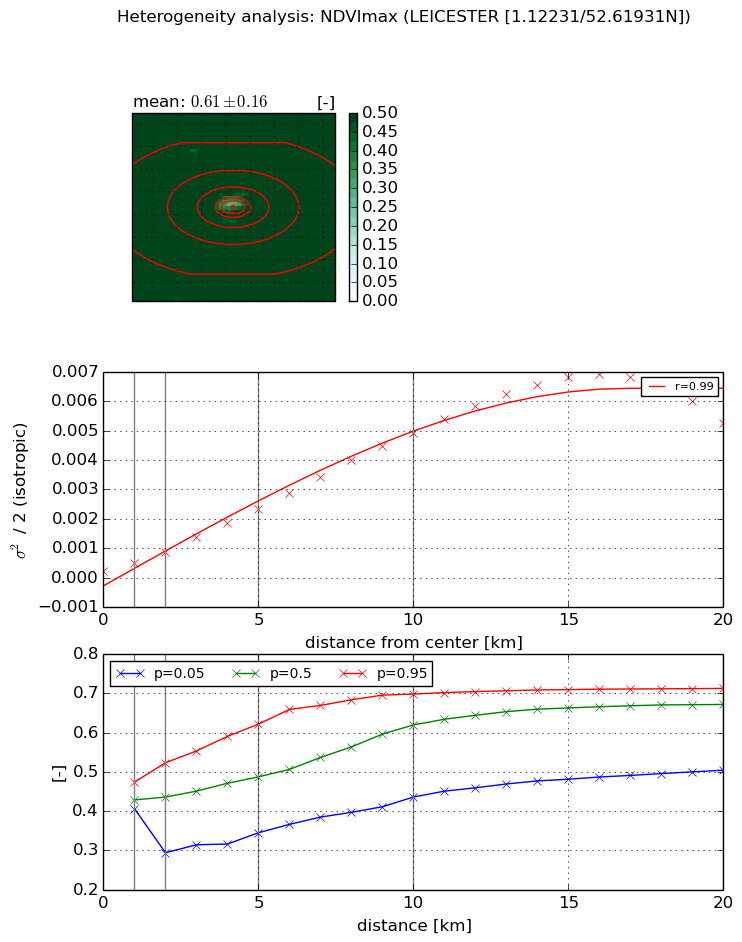
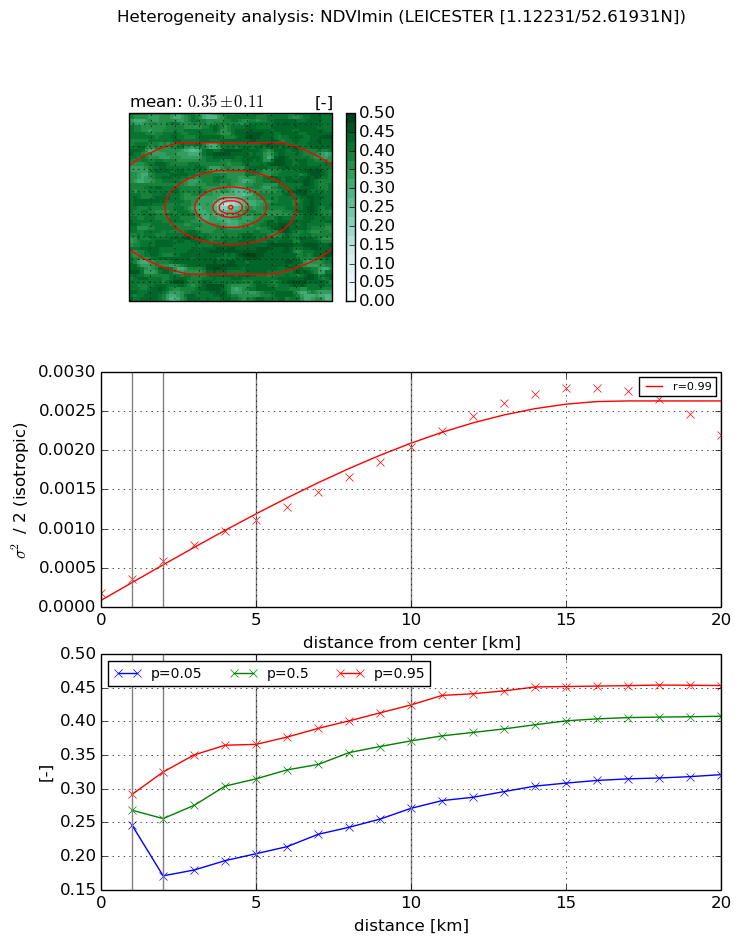
Heterogeneity analysis

The heterogeneity analysis provides information about the spatial and temporal heterogeneity of the site.

Topography


Roman et al. (2009) index


St

0.323010258069

Rcv

0.241719269391

Rse

0.0

Rst

3.56759476178e-08

Rsv

9.04591142818


Height range @ 1km [m]

28

Height range @ 2km [m]

34

Height range @ 5km [m]

54

Height range @ 10km [m]

-999

Height range @ 20km [m]

-999


Variance slope @ 1 km

70

Variance slope @ 2 km

71

Variance slope @ 5 km

72

Variance slope @ 10 km

-999

Variance slope @ 20 km

-999


NDVI (max. NDVI composite)


Roman et al. (2009) index


St

18.4271252813

Rcv

-0.139489580084

Rse

0.0

Rst

0.0119416991171

Rsv

0.0113721941677


NDVI range @ 1km [-]

0.07

NDVI range @ 2km [-]

0.23

NDVI range @ 5km [-]

0.28

NDVI range @ 10km [-]

0.26

NDVI range @ 20km [-]

0.21


Variance slope @ 1 km

0.000267495997026

Variance slope @ 2 km

0.000326070729561

Variance slope @ 5 km

0.000434388490751

Variance slope @ 10 km

0.000490328973579

Variance slope @ 20 km

0.000343021862967


NDVI (min. NDVI composite)I


Roman et al. (2009) index


St

4.54192059666

Rcv

-0.223430568087

Rse

0.0

Rst

0.132356907556

Rsv

-0.304726052975


NDVI range @ 1km [-]

0.05

NDVI range @ 2km [-]

0.15

NDVI range @ 5km [-]

0.16

NDVI range @ 10km [-]

0.15

NDVI range @ 20km [-]

0.13


NDVI slope @ 1 km

0.000185171234186

NDVI slope @ 2 km

0.000202559572568

NDVI slope @ 5 km

0.000190737303419

NDVI slope @ 10 km

0.000183192231783

NDVI slope @ 20 km

0.000129560391608


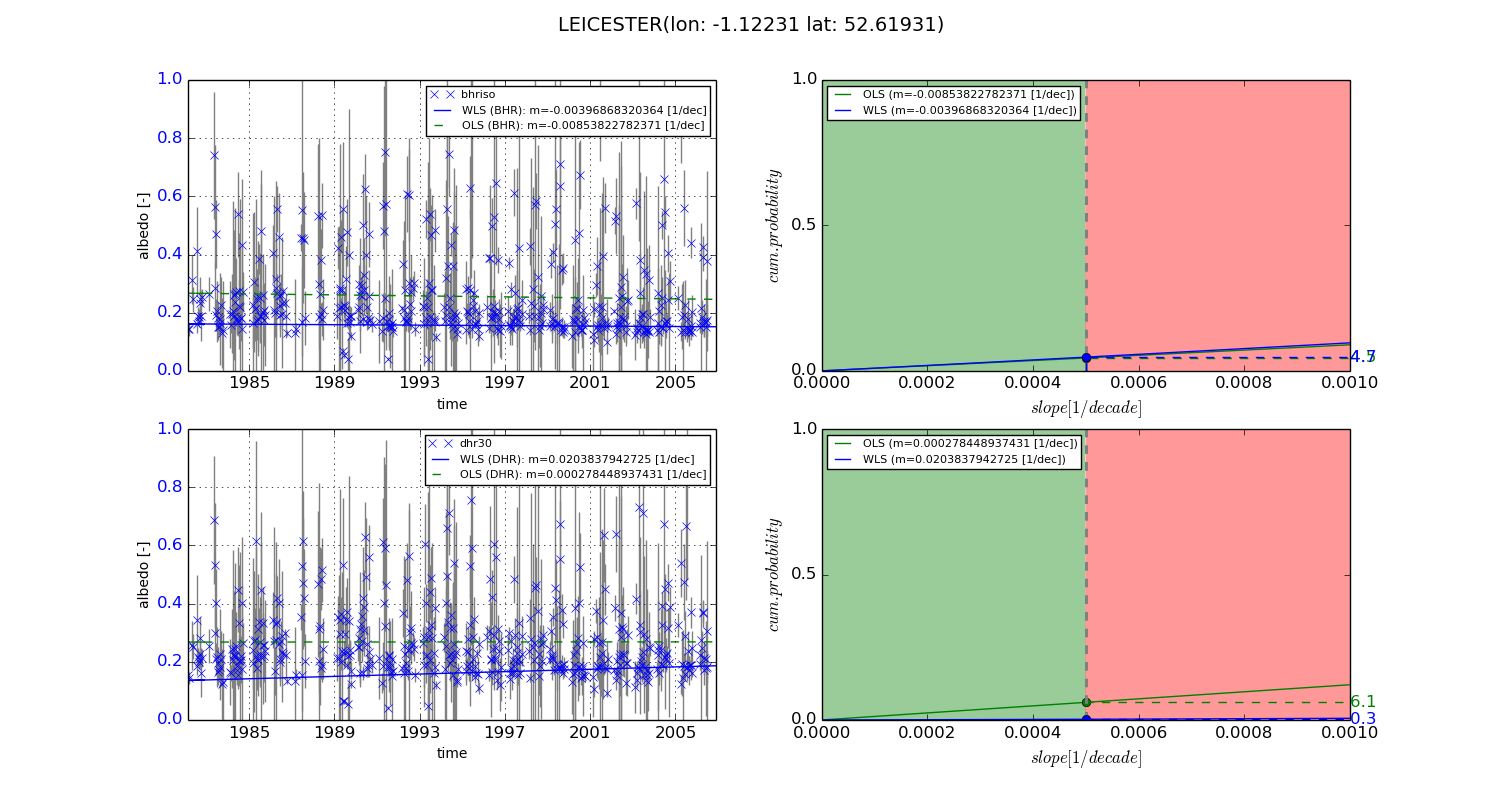
Temporal stability analysis

+000 deg (BHR)


BHR statistics

Temporal stability [1/decade]:


abs

rel


Weighted least square:

-0.00396868320364


Ordinary least square:

-0.00853822782371


Probabilities that GCOS criteria is met:

Weighted least square:

4.7 %

Ordinary least square:

4.5 %


DHR statistics

Temporal stability [1/decade]:


abs

rel


Weighted least square:

0.0203837942725


Ordinary least square:

0.000278448937431


Probabilities that GCOS criteria is met:

Weighted least square:

0.3 %

Ordinary least square:

6.1 %


+057/+063 deg (BHR)


BHR statistics

Temporal stability [1/decade]:


abs

rel


Weighted least square:

-99999.0


Ordinary least square:

-99999.0


Probabilities that GCOS criteria is met:

Weighted least square:

-99999.0 %

Ordinary least square:

-99999.0 %


DHR statistics

Temporal stability [1/decade]:


abs

rel


Weighted least square:

-99999.0


Ordinary least square:

-99999.0


Probabilities that GCOS criteria is met:

Weighted least square:

-99999.0 %

Ordinary least square:

-99999.0 %


Temporal anomaly analyis

The variance of the temporal anomalies provides an additional measure about the stability of the signal AFTER removal of the mean seasonal cylce.
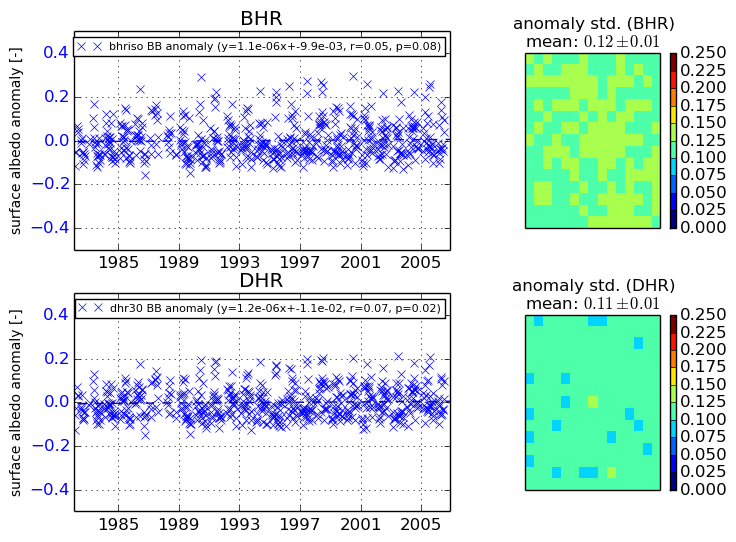
+000 deg


+057/+063 deg