LE_FAUGA


Location

lon / lat [deg]: 1.2846 / 43.3842

Source network: AERONET


Geostationary surface albedo (GSA) data


“+000”


“+057/+063”


Landcover information (based on ESA CCI landcover data)


Landcover fractions @ 2km distance


Landcover fractions @ 20 km distance


Legend


Distance to open water bodies [km]:

0.89

Distance to urban areas [km]:

0.22


Radius: 1 km

Number of landcover classes:

6

Dominant landcover type:

190: urban areas

Fraction of dominant landcover type [%]:

34.0


Radius: 2 km

Number of landcover classes:

6

Dominant landcover type:

10: cropland, rainfed

Fraction of dominant landcover type [%]:

44.0


Radius: 5 km

Number of landcover classes:

4

Dominant landcover type:

10: cropland, rainfed

Fraction of dominant landcover type [%]:

78.0


Radius: 10 km

Number of landcover classes:

5

Dominant landcover type:

10: cropland, rainfed

Fraction of dominant landcover type [%]:

85.0


Radius: 20 km

Number of landcover classes:

5

Dominant landcover type:

10: cropland, rainfed

Fraction of dominant landcover type [%]:

85.0


Disturbances


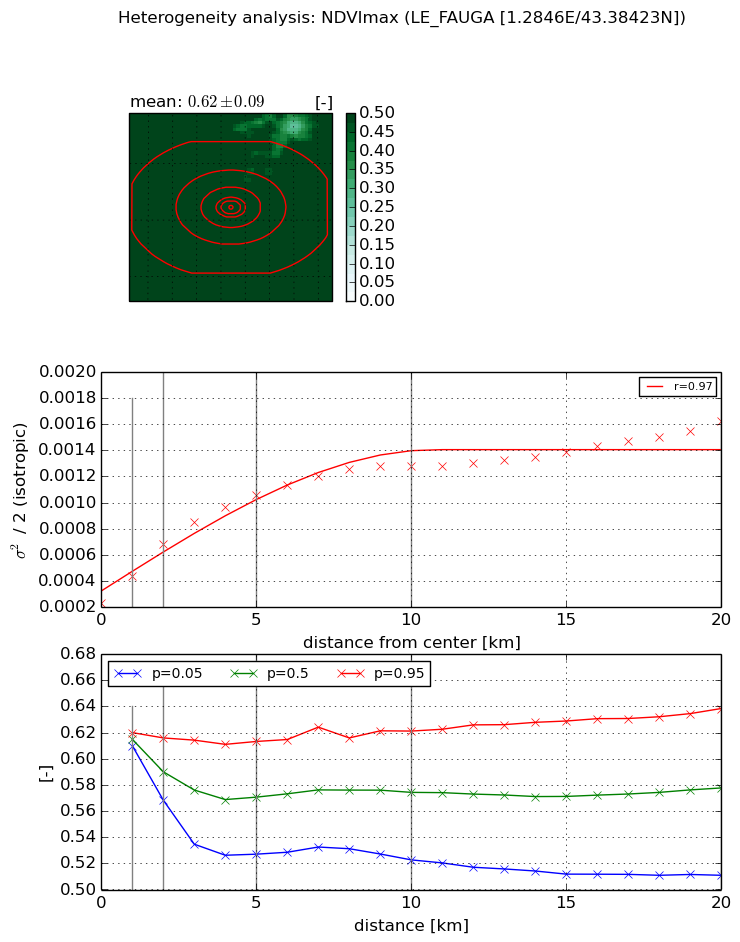
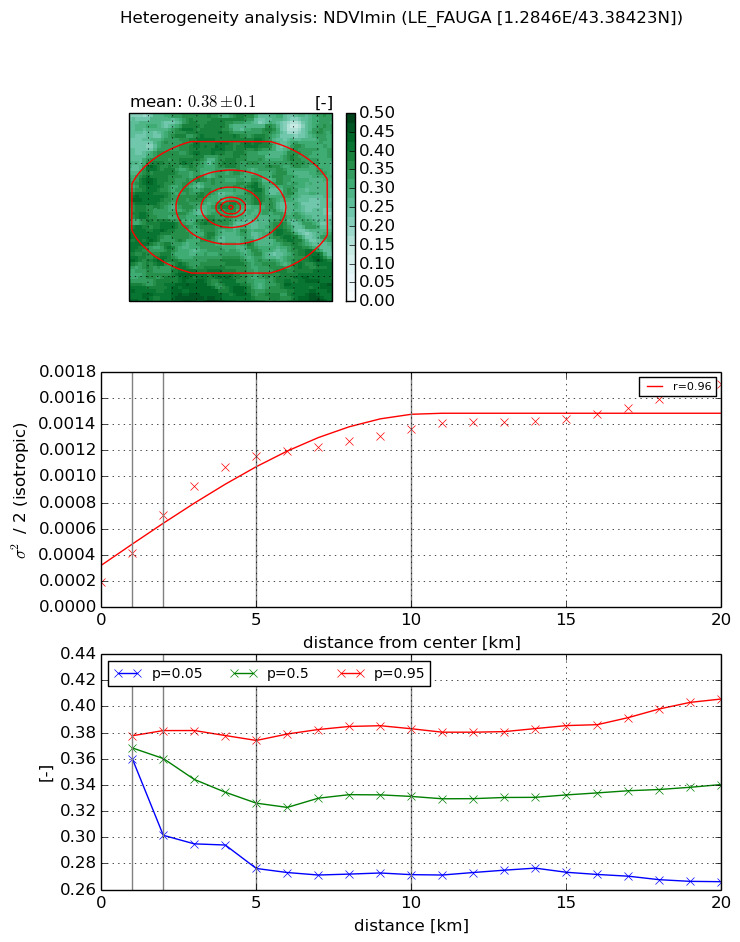
Heterogeneity analysis

The heterogeneity analysis provides information about the spatial and temporal heterogeneity of the site.

Topography


Roman et al. (2009) index


St

7.14609810825

Rcv

0.0410028171655

Rse

0.0

Rst

0.0861473254109

Rsv

-0.292659375087


Height range @ 1km [m]

10

Height range @ 2km [m]

72

Height range @ 5km [m]

89

Height range @ 10km [m]

-999

Height range @ 20km [m]

-999


Variance slope @ 1 km

327

Variance slope @ 2 km

291

Variance slope @ 5 km

163

Variance slope @ 10 km

-999

Variance slope @ 20 km

-999


NDVI (max. NDVI composite)


Roman et al. (2009) index


St

0.637219341053

Rcv

0.154399487732

Rse

0.0

Rst

-0.526630876993

Rsv

4.02692466226


NDVI range @ 1km [-]

0.01

NDVI range @ 2km [-]

0.05

NDVI range @ 5km [-]

0.09

NDVI range @ 10km [-]

0.1

NDVI range @ 20km [-]

0.13


Variance slope @ 1 km

0.000208729847412

Variance slope @ 2 km

0.000225570758957

Variance slope @ 5 km

0.000167815703798

Variance slope @ 10 km

0.000101935876571

Variance slope @ 20 km

5.26309716955e-05


NDVI (min. NDVI composite)I


Roman et al. (2009) index


St

5.78901159369

Rcv

0.169284152443

Rse

0.0

Rst

-0.0712623895033

Rsv

0.277676638547


NDVI range @ 1km [-]

0.02

NDVI range @ 2km [-]

0.08

NDVI range @ 5km [-]

0.1

NDVI range @ 10km [-]

0.11

NDVI range @ 20km [-]

0.14


NDVI slope @ 1 km

0.000221241921542

NDVI slope @ 2 km

0.000254009012712

NDVI slope @ 5 km

0.000200139070064

NDVI slope @ 10 km

0.000107415154884

NDVI slope @ 20 km

5.62006343728e-05


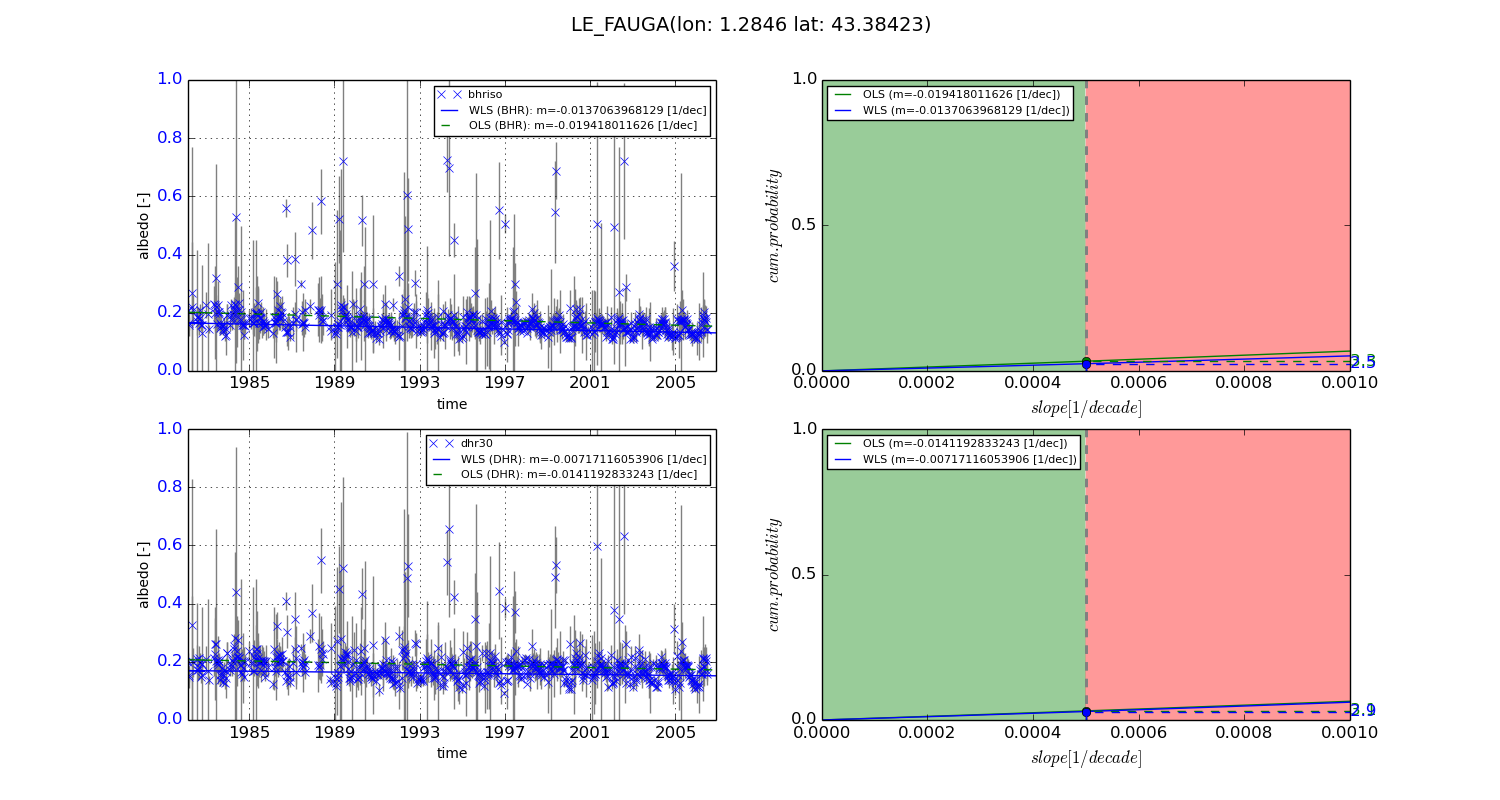
Temporal stability analysis

+000 deg (BHR)


BHR statistics

Temporal stability [1/decade]:


abs

rel


Weighted least square:

-0.0137063968129


Ordinary least square:

-0.019418011626


Probabilities that GCOS criteria is met:

Weighted least square:

2.5 %

Ordinary least square:

3.3 %


DHR statistics

Temporal stability [1/decade]:


abs

rel


Weighted least square:

-0.00717116053906


Ordinary least square:

-0.0141192833243


Probabilities that GCOS criteria is met:

Weighted least square:

2.9 %

Ordinary least square:

3.1 %


+057/+063 deg (BHR)


BHR statistics

Temporal stability [1/decade]:


abs

rel


Weighted least square:

-99999.0


Ordinary least square:

-99999.0


Probabilities that GCOS criteria is met:

Weighted least square:

-99999.0 %

Ordinary least square:

-99999.0 %


DHR statistics

Temporal stability [1/decade]:


abs

rel


Weighted least square:

-99999.0


Ordinary least square:

-99999.0


Probabilities that GCOS criteria is met:

Weighted least square:

-99999.0 %

Ordinary least square:

-99999.0 %


Temporal anomaly analyis

The variance of the temporal anomalies provides an additional measure about the stability of the signal AFTER removal of the mean seasonal cylce.

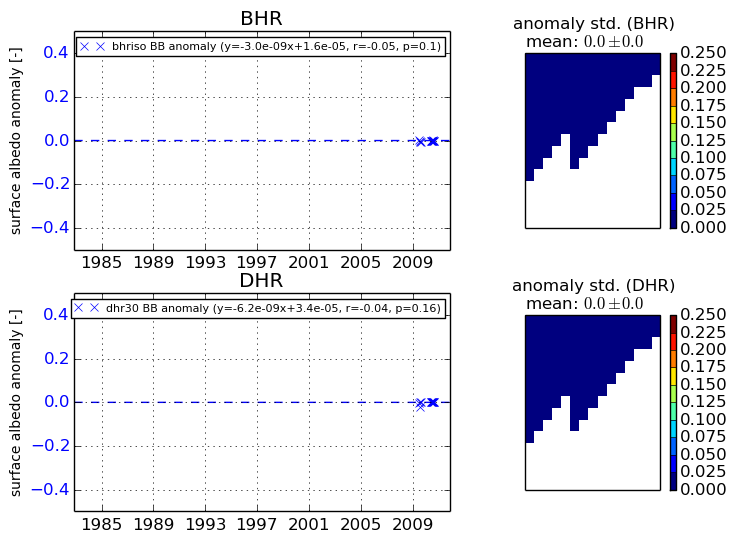
+000 deg


+057/+063 deg