LHASA


Location

lon / lat [deg]: 91.0329 / 29.6455

Source network: AERONET


Geostationary surface albedo (GSA) data


“+000”


“+057/+063”


Landcover information (based on ESA CCI landcover data)


Landcover fractions @ 2km distance


Landcover fractions @ 20 km distance


Legend


Distance to open water bodies [km]:

23.8

Distance to urban areas [km]:

4.5


Radius: 1 km

Number of landcover classes:

3

Dominant landcover type:

130: grassland

Fraction of dominant landcover type [%]:

55.0


Radius: 2 km

Number of landcover classes:

4

Dominant landcover type:

130: grassland

Fraction of dominant landcover type [%]:

75.0


Radius: 5 km

Number of landcover classes:

6

Dominant landcover type:

130: grassland

Fraction of dominant landcover type [%]:

78.0


Radius: 10 km

Number of landcover classes:

7

Dominant landcover type:

130: grassland

Fraction of dominant landcover type [%]:

75.0


Radius: 20 km

Number of landcover classes:

8

Dominant landcover type:

130: grassland

Fraction of dominant landcover type [%]:

78.0


Disturbances


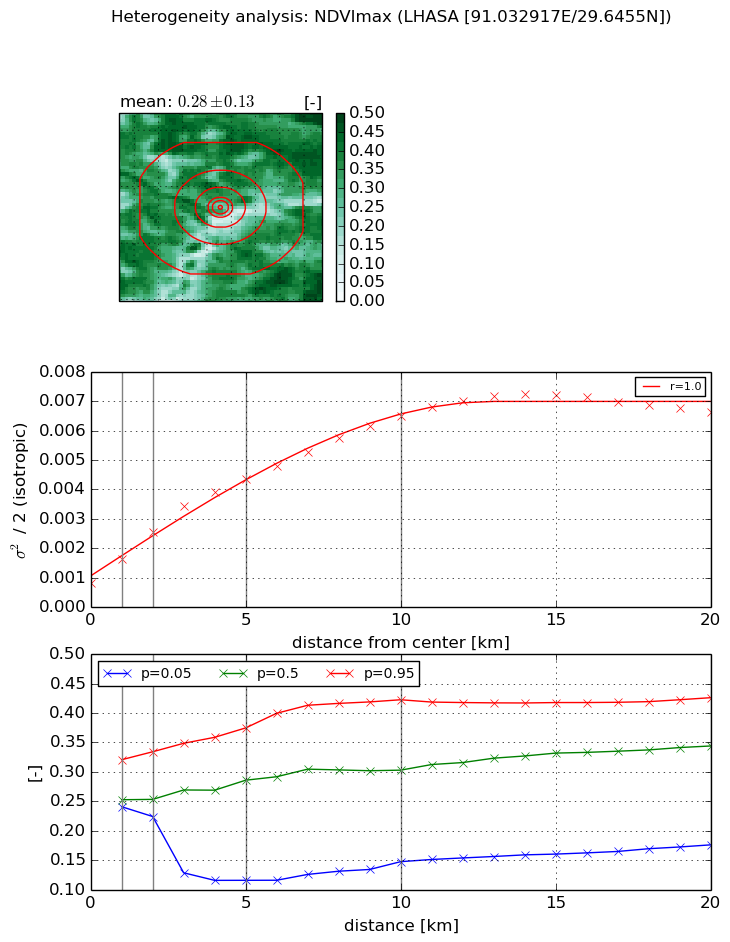
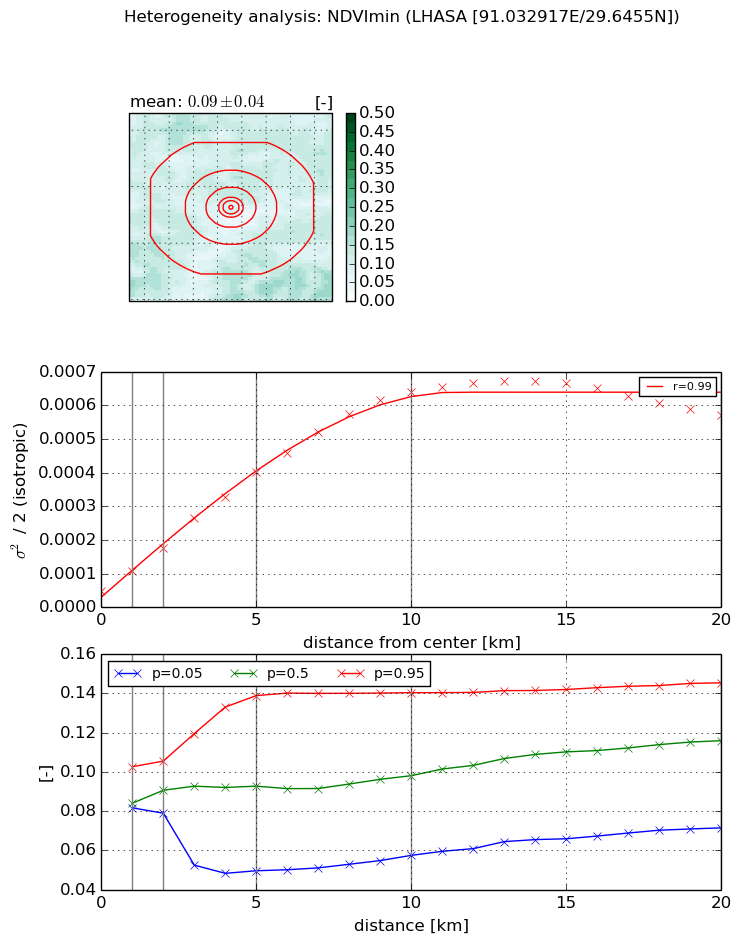
Heterogeneity analysis

The heterogeneity analysis provides information about the spatial and temporal heterogeneity of the site.

Topography


Roman et al. (2009) index


St

0.000590091895386

Rcv

0.435763795148

Rse

0.0

Rst

0.0414288218346

Rsv

5083.4767194


Height range @ 1km [m]

6

Height range @ 2km [m]

93

Height range @ 5km [m]

619

Height range @ 10km [m]

-999

Height range @ 20km [m]

-999


Variance slope @ 1 km

10376

Variance slope @ 2 km

11848

Variance slope @ 5 km

12741

Variance slope @ 10 km

-999

Variance slope @ 20 km

-999


NDVI (max. NDVI composite)


Roman et al. (2009) index


St

4.85299865422e-08

Rcv

0.340094976403

Rse

0.0

Rst

0.168172907098

Rsv

61817449.1503


NDVI range @ 1km [-]

0.08

NDVI range @ 2km [-]

0.11

NDVI range @ 5km [-]

0.26

NDVI range @ 10km [-]

0.28

NDVI range @ 20km [-]

0.25


Variance slope @ 1 km

0.000820603843155

Variance slope @ 2 km

0.000866070047574

Variance slope @ 5 km

0.00073177329479

Variance slope @ 10 km

0.000552948952401

Variance slope @ 20 km

0.000280211219955


NDVI (min. NDVI composite)I


Roman et al. (2009) index


St

2.72135740643

Rcv

0.475955427219

Rse

0.0

Rst

-2.19236219255e-08

Rsv

-0.626435582964


NDVI range @ 1km [-]

0.02

NDVI range @ 2km [-]

0.03

NDVI range @ 5km [-]

0.09

NDVI range @ 10km [-]

0.08

NDVI range @ 20km [-]

0.07


NDVI slope @ 1 km

5.66060063476e-05

NDVI slope @ 2 km

6.34719615613e-05

NDVI slope @ 5 km

7.18306556087e-05

NDVI slope @ 10 km

6.20488589313e-05

NDVI slope @ 20 km

2.64163276475e-05


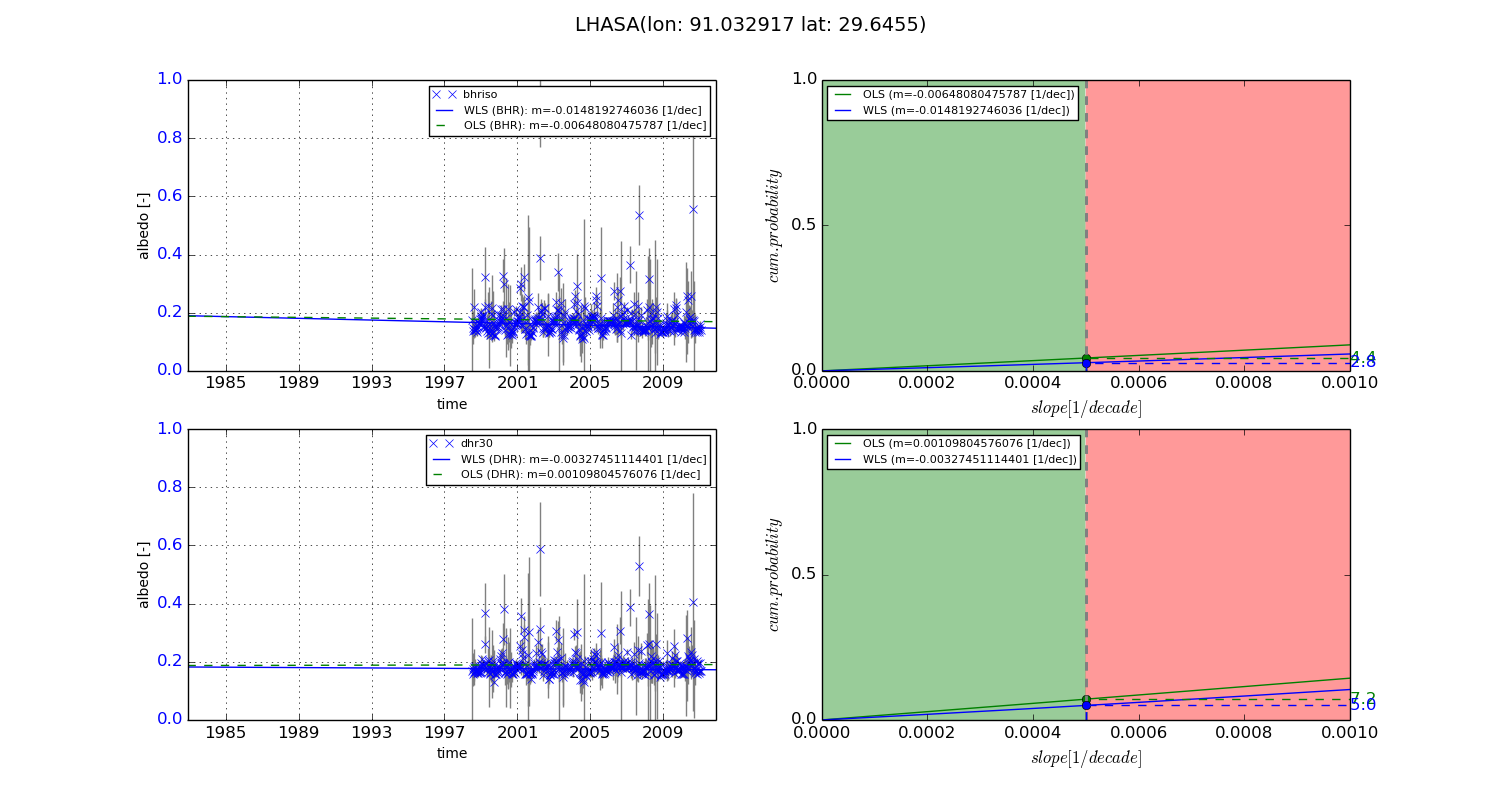
Temporal stability analysis

+000 deg (BHR)


BHR statistics

Temporal stability [1/decade]:


abs

rel


Weighted least square:

None


Ordinary least square:

None


Probabilities that GCOS criteria is met:

Weighted least square:

None %

Ordinary least square:

None %


DHR statistics

Temporal stability [1/decade]:


abs

rel


Weighted least square:

None


Ordinary least square:

None


Probabilities that GCOS criteria is met:

Weighted least square:

None %

Ordinary least square:

None %


+057/+063 deg (BHR)


BHR statistics

Temporal stability [1/decade]:


abs

rel


Weighted least square:

-0.0148192746036


Ordinary least square:

-0.00648080475787


Probabilities that GCOS criteria is met:

Weighted least square:

2.8 %

Ordinary least square:

4.4 %


DHR statistics

Temporal stability [1/decade]:


abs

rel


Weighted least square:

-0.00327451114401


Ordinary least square:

0.00109804576076


Probabilities that GCOS criteria is met:

Weighted least square:

5.0 %

Ordinary least square:

7.2 %


Temporal anomaly analyis

The variance of the temporal anomalies provides an additional measure about the stability of the signal AFTER removal of the mean seasonal cylce.

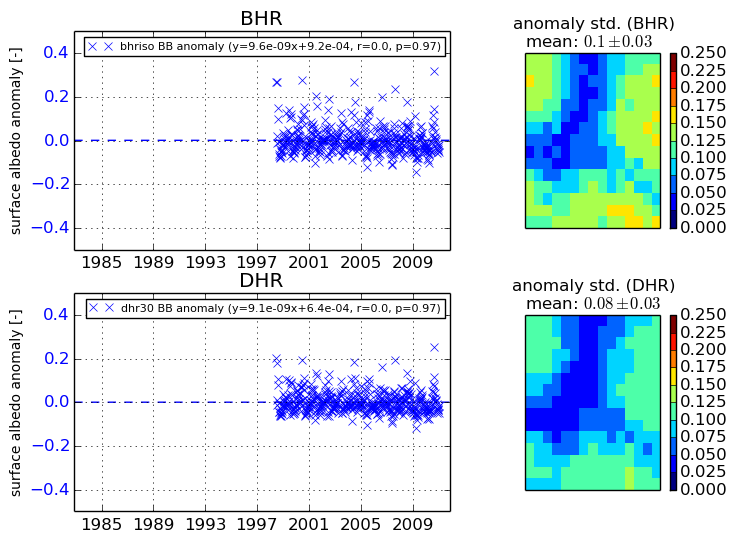
+000 deg


+057/+063 deg