LIANGNING


Location

lon / lat [deg]: 122.7013 / 41.5118

Source network: AERONET


Geostationary surface albedo (GSA) data


“+000”


“+057/+063”


Landcover information (based on ESA CCI landcover data)


Landcover fractions @ 2km distance


Landcover fractions @ 20 km distance


Legend


Distance to open water bodies [km]:

13.09

Distance to urban areas [km]:

0.08


Radius: 1 km

Number of landcover classes:

4

Dominant landcover type:

10: cropland, rainfed

Fraction of dominant landcover type [%]:

40.0


Radius: 2 km

Number of landcover classes:

5

Dominant landcover type:

10: cropland, rainfed

Fraction of dominant landcover type [%]:

33.0


Radius: 5 km

Number of landcover classes:

3

Dominant landcover type:

20: cropland, irrigated or post-flooded

Fraction of dominant landcover type [%]:

51.0


Radius: 10 km

Number of landcover classes:

4

Dominant landcover type:

20: cropland, irrigated or post-flooded

Fraction of dominant landcover type [%]:

68.0


Radius: 20 km

Number of landcover classes:

5

Dominant landcover type:

20: cropland, irrigated or post-flooded

Fraction of dominant landcover type [%]:

58.0


Disturbances


Heterogeneity analysis

The heterogeneity analysis provides information about the spatial and temporal heterogeneity of the site.

Topography


Roman et al. (2009) index


St

3.29997519036

Rcv

0.0983557966513

Rse

0.0

Rst

0.049292109442

Rsv

-0.761449837662


Height range @ 1km [m]

4

Height range @ 2km [m]

5

Height range @ 5km [m]

6

Height range @ 10km [m]

-999

Height range @ 20km [m]

-999


Variance slope @ 1 km

0

Variance slope @ 2 km

0

Variance slope @ 5 km

0

Variance slope @ 10 km

-999

Variance slope @ 20 km

-999


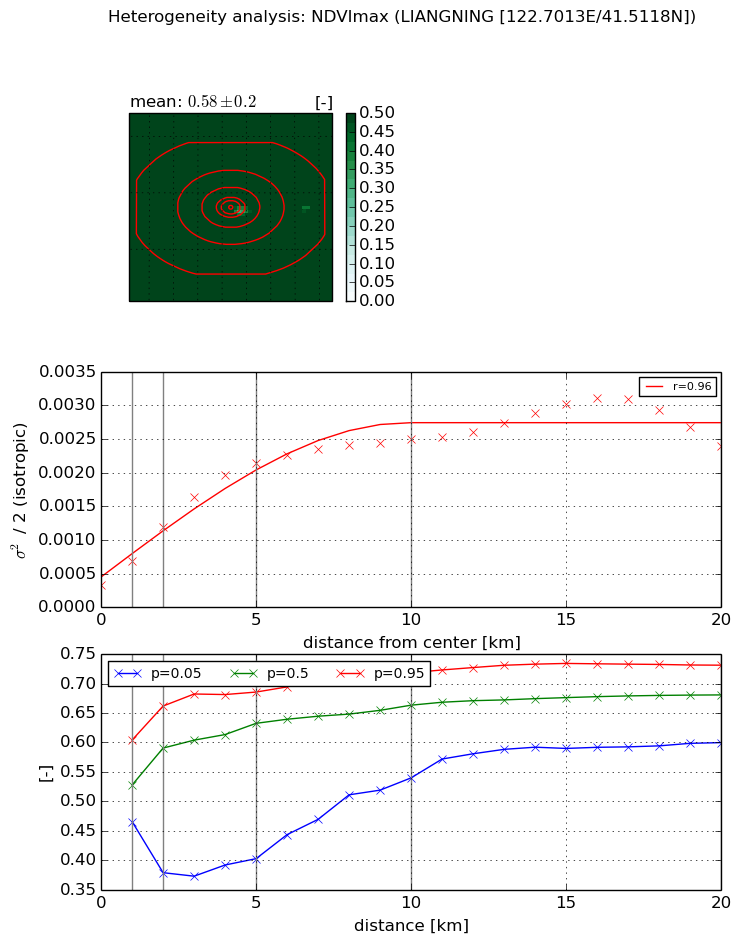
NDVI (max. NDVI composite)


Roman et al. (2009) index


St

6.73863955082

Rcv

-0.269975558312

Rse

0.0

Rst

-0.0130724877532

Rsv

-0.162145672545


NDVI range @ 1km [-]

0.14

NDVI range @ 2km [-]

0.28

NDVI range @ 5km [-]

0.28

NDVI range @ 10km [-]

0.18

NDVI range @ 20km [-]

0.13


Variance slope @ 1 km

0.000361779165249

Variance slope @ 2 km

0.000436244955248

Variance slope @ 5 km

0.000382661827784

Variance slope @ 10 km

0.000211804527736

Variance slope @ 20 km

0.000101681761429


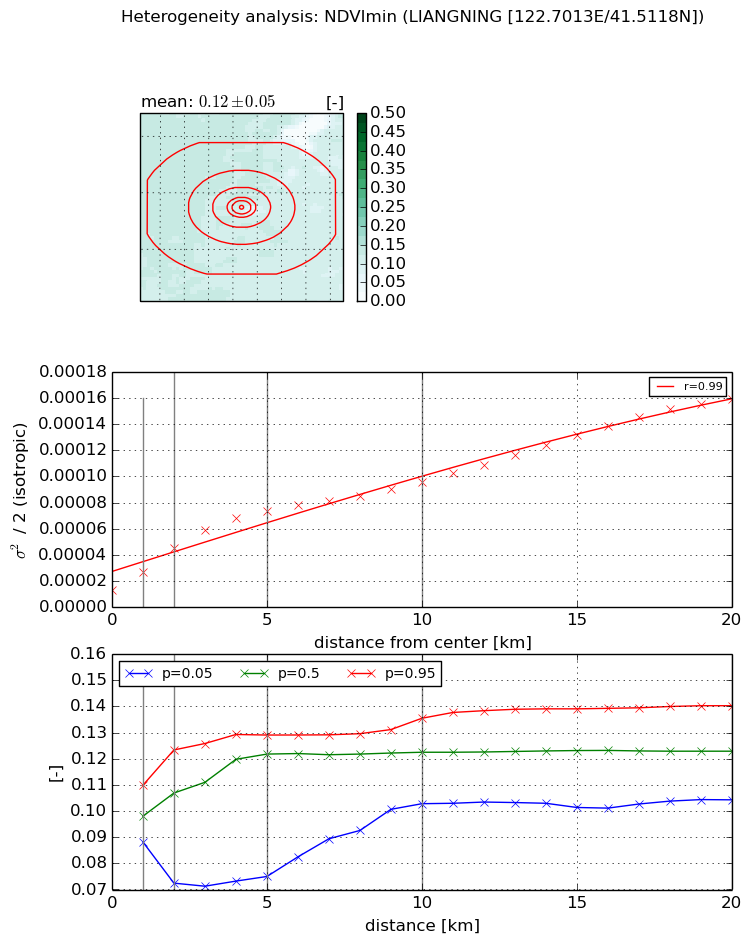
NDVI (min. NDVI composite)I


Roman et al. (2009) index


St

7.56216853561

Rcv

-0.222863023457

Rse

0.0

Rst

-0.0252745365524

Rsv

-0.148574042737


NDVI range @ 1km [-]

0.02

NDVI range @ 2km [-]

0.05

NDVI range @ 5km [-]

0.05

NDVI range @ 10km [-]

0.03

NDVI range @ 20km [-]

0.04


NDVI slope @ 1 km

1.40616798595e-05

NDVI slope @ 2 km

1.59757983425e-05

NDVI slope @ 5 km

1.25119002943e-05

NDVI slope @ 10 km

7.66698660302e-06

NDVI slope @ 20 km

6.68361024685e-06


Temporal stability analysis

+000 deg (BHR)


BHR statistics

Temporal stability [1/decade]:


abs

rel


Weighted least square:

None


Ordinary least square:

None


Probabilities that GCOS criteria is met:

Weighted least square:

None %

Ordinary least square:

None %


DHR statistics

Temporal stability [1/decade]:


abs

rel


Weighted least square:

None


Ordinary least square:

None


Probabilities that GCOS criteria is met:

Weighted least square:

None %

Ordinary least square:

None %


+057/+063 deg (BHR)


BHR statistics

Temporal stability [1/decade]:


abs

rel


Weighted least square:

-99999.0


Ordinary least square:

-99999.0


Probabilities that GCOS criteria is met:

Weighted least square:

-99999.0 %

Ordinary least square:

-99999.0 %


DHR statistics

Temporal stability [1/decade]:


abs

rel


Weighted least square:

-99999.0


Ordinary least square:

-99999.0


Probabilities that GCOS criteria is met:

Weighted least square:

-99999.0 %

Ordinary least square:

-99999.0 %


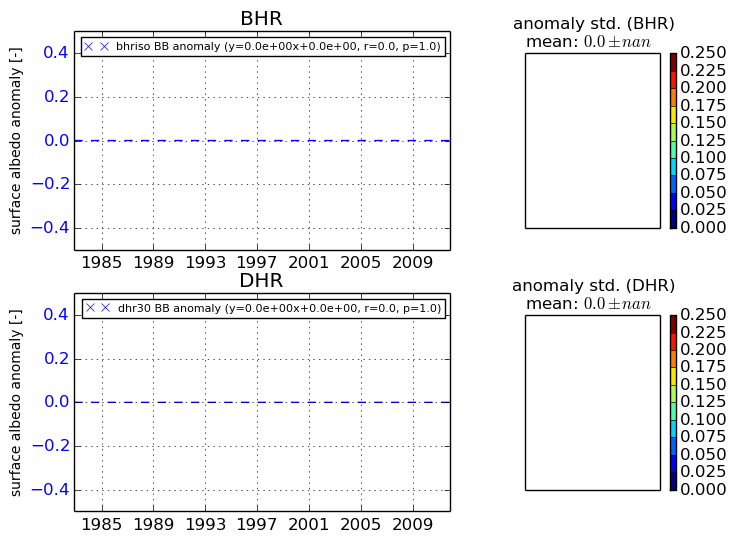
Temporal anomaly analyis

The variance of the temporal anomalies provides an additional measure about the stability of the signal AFTER removal of the mean seasonal cylce.

+000 deg


+057/+063 deg