LIBIA_00002


Location

lon / lat [deg]: 8.5839 / 25.8461

Source network: ALBEDOVAL2


Geostationary surface albedo (GSA) data


“+000”


“+057/+063”


Landcover information (based on ESA CCI landcover data)


Landcover fractions @ 2km distance


Landcover fractions @ 20 km distance


Legend


Distance to open water bodies [km]:

none in region

Distance to urban areas [km]:

none in region


Radius: 1 km

Number of landcover classes:

1

Dominant landcover type:

200: bare areas

Fraction of dominant landcover type [%]:

100.0


Radius: 2 km

Number of landcover classes:

1

Dominant landcover type:

200: bare areas

Fraction of dominant landcover type [%]:

100.0


Radius: 5 km

Number of landcover classes:

1

Dominant landcover type:

200: bare areas

Fraction of dominant landcover type [%]:

100.0


Radius: 10 km

Number of landcover classes:

1

Dominant landcover type:

200: bare areas

Fraction of dominant landcover type [%]:

100.0


Radius: 20 km

Number of landcover classes:

1

Dominant landcover type:

200: bare areas

Fraction of dominant landcover type [%]:

100.0


Disturbances


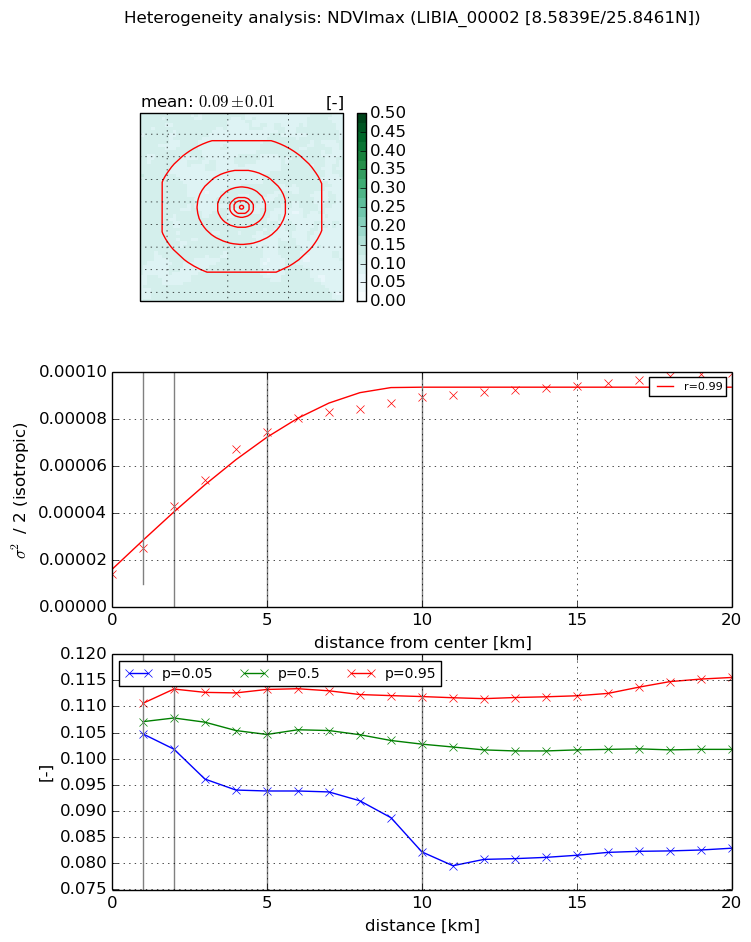
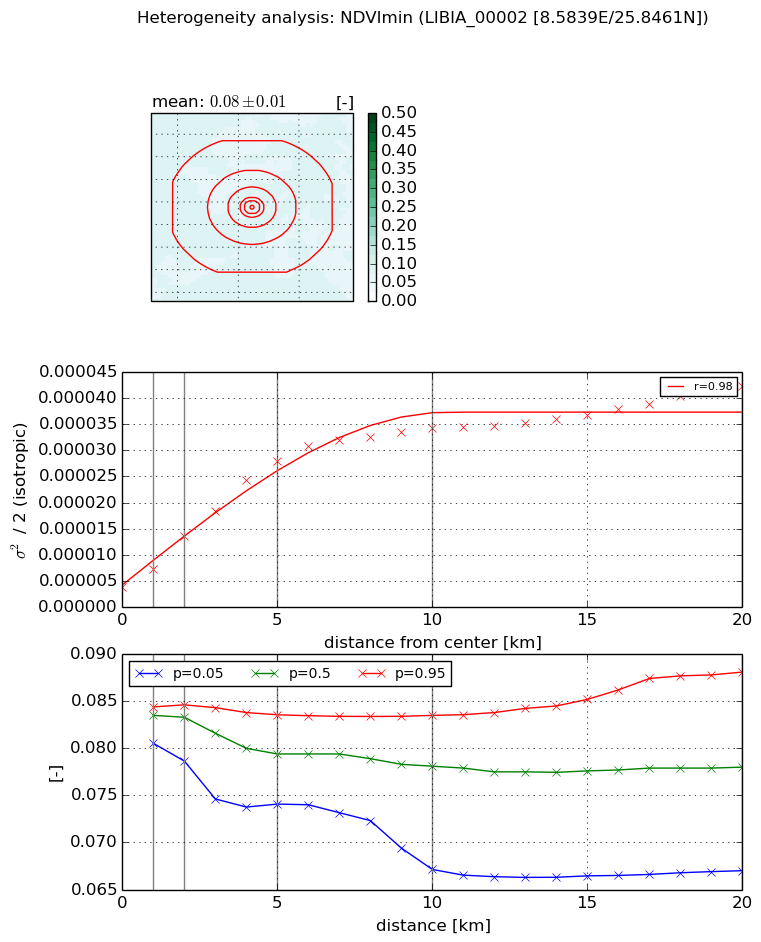
Heterogeneity analysis

The heterogeneity analysis provides information about the spatial and temporal heterogeneity of the site.

Topography


Roman et al. (2009) index


St

12.232120324

Rcv

0.171068835346

Rse

0.0

Rst

-0.0494616481489

Rsv

0.0247254427489


Height range @ 1km [m]

143

Height range @ 2km [m]

398

Height range @ 5km [m]

520

Height range @ 10km [m]

-999

Height range @ 20km [m]

-999


Variance slope @ 1 km

11797

Variance slope @ 2 km

11854

Variance slope @ 5 km

6343

Variance slope @ 10 km

-999

Variance slope @ 20 km

-999


NDVI (max. NDVI composite)


Roman et al. (2009) index


St

nan

Rcv

nan

Rse

nan

Rst

nan

Rsv

nan


NDVI range @ 1km [-]

0.01

NDVI range @ 2km [-]

0.01

NDVI range @ 5km [-]

0.02

NDVI range @ 10km [-]

0.03

NDVI range @ 20km [-]

0.03


Variance slope @ 1 km

1.0881474533e-05

Variance slope @ 2 km

1.44259736021e-05

Variance slope @ 5 km

1.25820585902e-05

Variance slope @ 10 km

7.4309073382e-06

Variance slope @ 20 km

3.40801231501e-06


NDVI (min. NDVI composite)I


Roman et al. (2009) index


St

1.75958741702

Rcv

0.0102738547088

Rse

0.0

Rst

1.09224321217

Rsv

-0.602428064558


NDVI range @ 1km [-]

0.0

NDVI range @ 2km [-]

0.01

NDVI range @ 5km [-]

0.01

NDVI range @ 10km [-]

0.02

NDVI range @ 20km [-]

0.02


NDVI slope @ 1 km

3.36118837364e-06

NDVI slope @ 2 km

4.86613156961e-06

NDVI slope @ 5 km

5.02549739726e-06

NDVI slope @ 10 km

3.15345222468e-06

NDVI slope @ 20 km

1.56860235876e-06


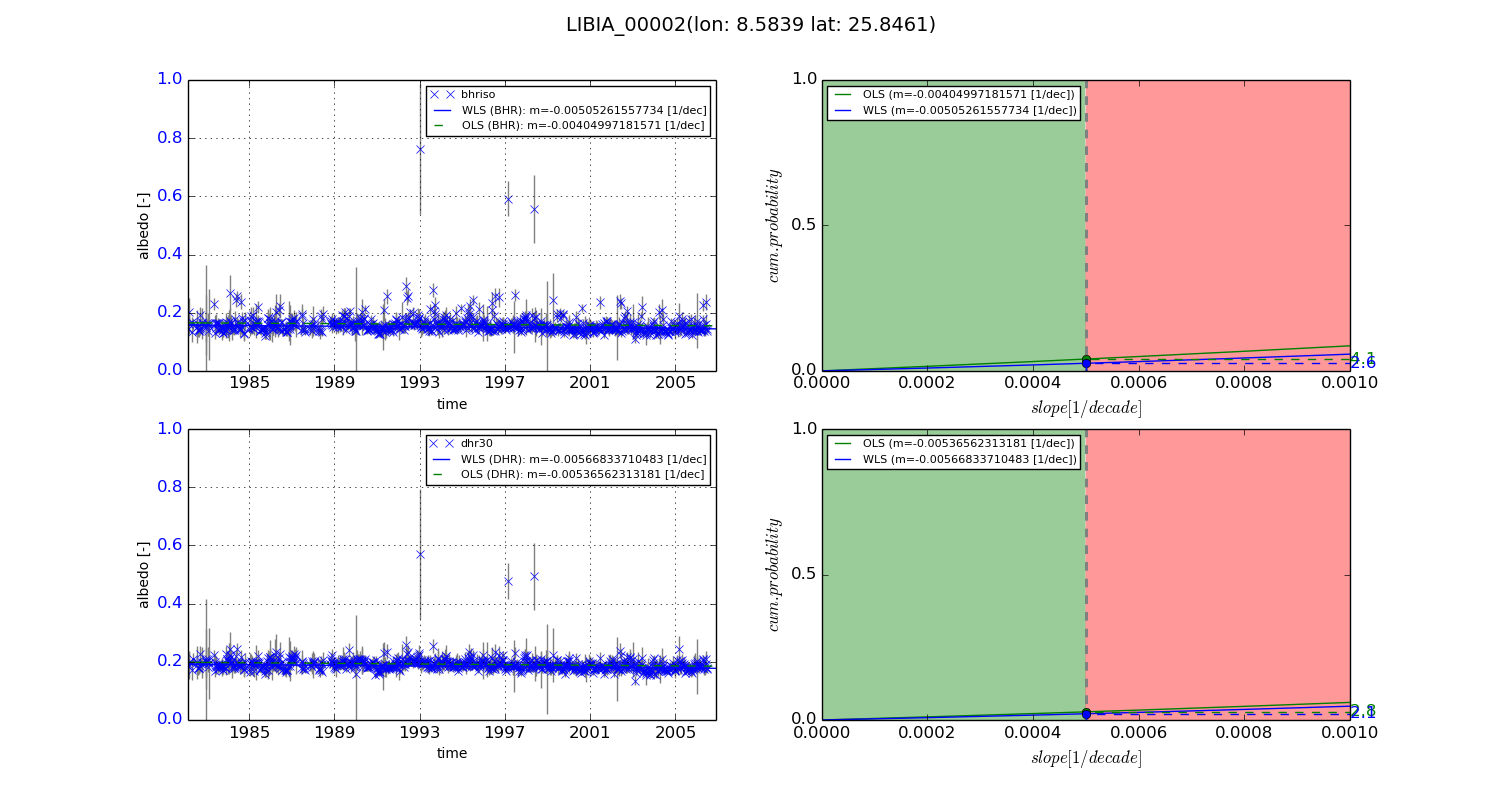
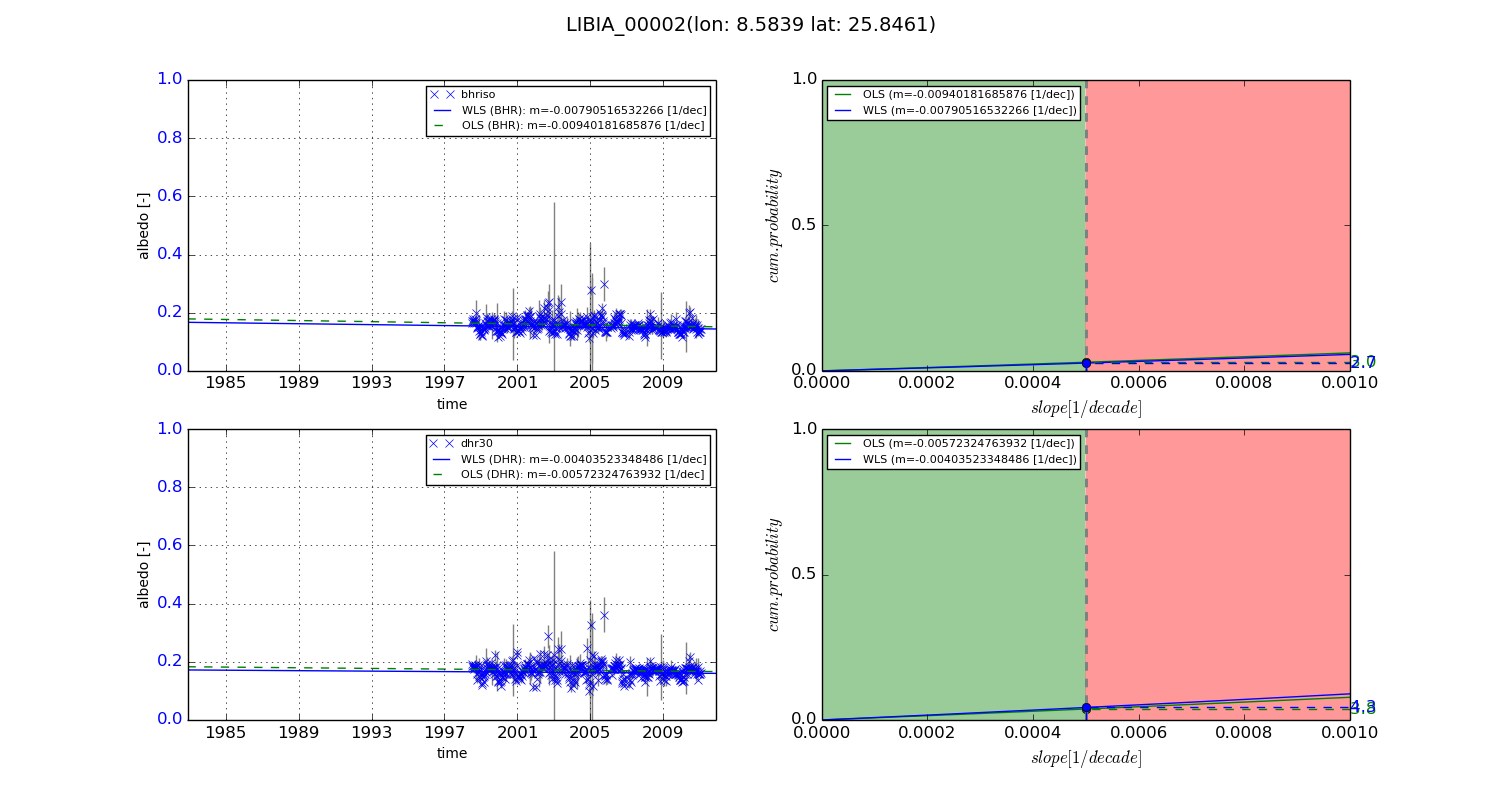
Temporal stability analysis

+000 deg (BHR)


BHR statistics

Temporal stability [1/decade]:


abs

rel


Weighted least square:

-0.00505261557734


Ordinary least square:

-0.00404997181571


Probabilities that GCOS criteria is met:

Weighted least square:

2.6 %

Ordinary least square:

4.1 %


DHR statistics

Temporal stability [1/decade]:


abs

rel


Weighted least square:

-0.00566833710483


Ordinary least square:

-0.00536562313181


Probabilities that GCOS criteria is met:

Weighted least square:

2.1 %

Ordinary least square:

2.8 %


+057/+063 deg (BHR)


BHR statistics

Temporal stability [1/decade]:


abs

rel


Weighted least square:

-0.00790516532266


Ordinary least square:

-0.00940181685876


Probabilities that GCOS criteria is met:

Weighted least square:

2.7 %

Ordinary least square:

3.0 %


DHR statistics

Temporal stability [1/decade]:


abs

rel


Weighted least square:

-0.00403523348486


Ordinary least square:

-0.00572324763932


Probabilities that GCOS criteria is met:

Weighted least square:

4.3 %

Ordinary least square:

3.8 %


Temporal anomaly analyis

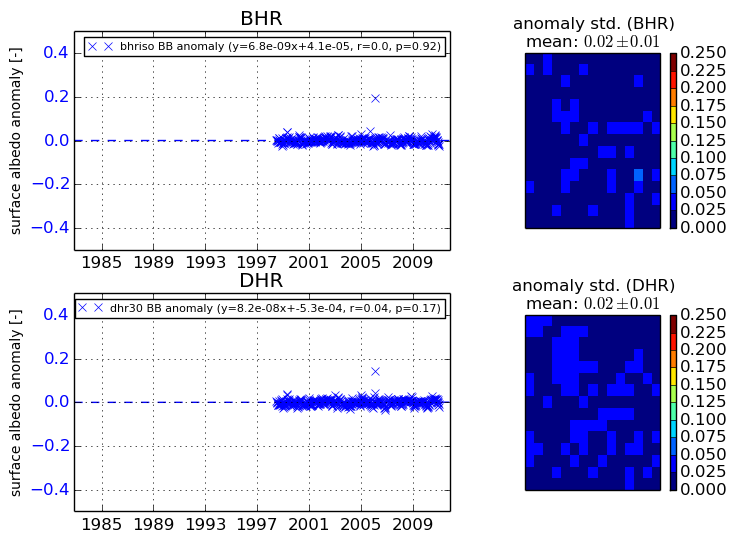
The variance of the temporal anomalies provides an additional measure about the stability of the signal AFTER removal of the mean seasonal cylce.
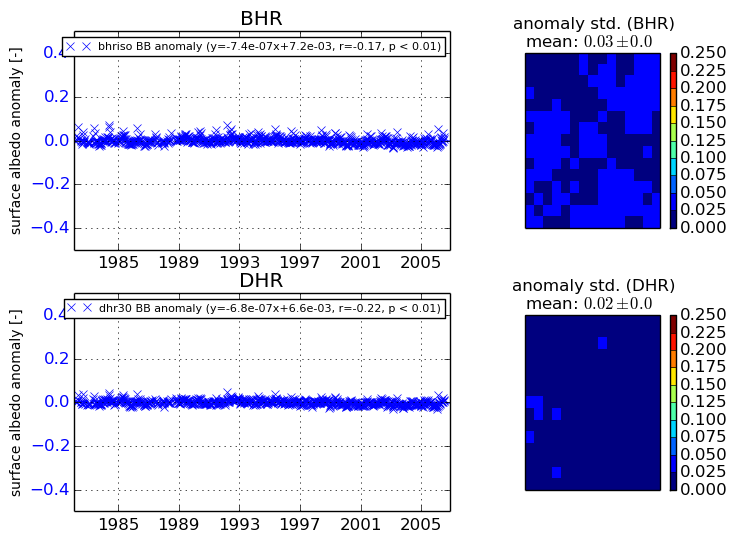
+000 deg


+057/+063 deg