LIBYA


Location

lon / lat [deg]: 28.5 / 21.5

Source network: ALBEDOVAL1


Geostationary surface albedo (GSA) data


“+000”


“+057/+063”


Landcover information (based on ESA CCI landcover data)


Landcover fractions @ 2km distance


Landcover fractions @ 20 km distance


Legend


Distance to open water bodies [km]:

none in region

Distance to urban areas [km]:

none in region


Radius: 1 km

Number of landcover classes:

1

Dominant landcover type:

200: bare areas

Fraction of dominant landcover type [%]:

100.0


Radius: 2 km

Number of landcover classes:

1

Dominant landcover type:

200: bare areas

Fraction of dominant landcover type [%]:

100.0


Radius: 5 km

Number of landcover classes:

1

Dominant landcover type:

200: bare areas

Fraction of dominant landcover type [%]:

100.0


Radius: 10 km

Number of landcover classes:

1

Dominant landcover type:

200: bare areas

Fraction of dominant landcover type [%]:

100.0


Radius: 20 km

Number of landcover classes:

1

Dominant landcover type:

200: bare areas

Fraction of dominant landcover type [%]:

100.0


Disturbances


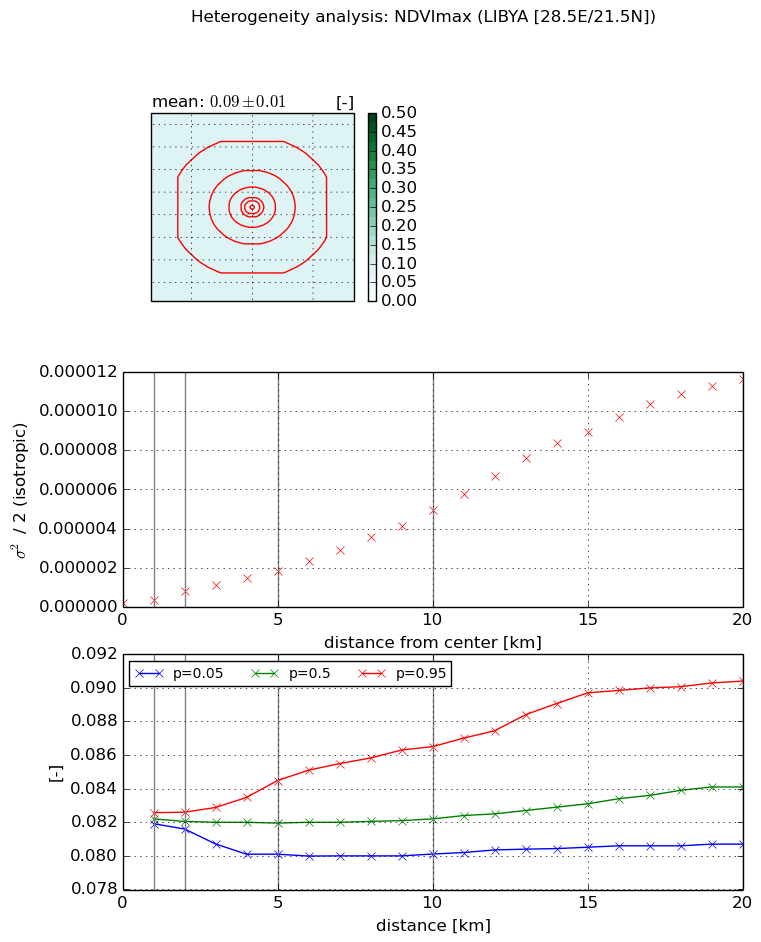
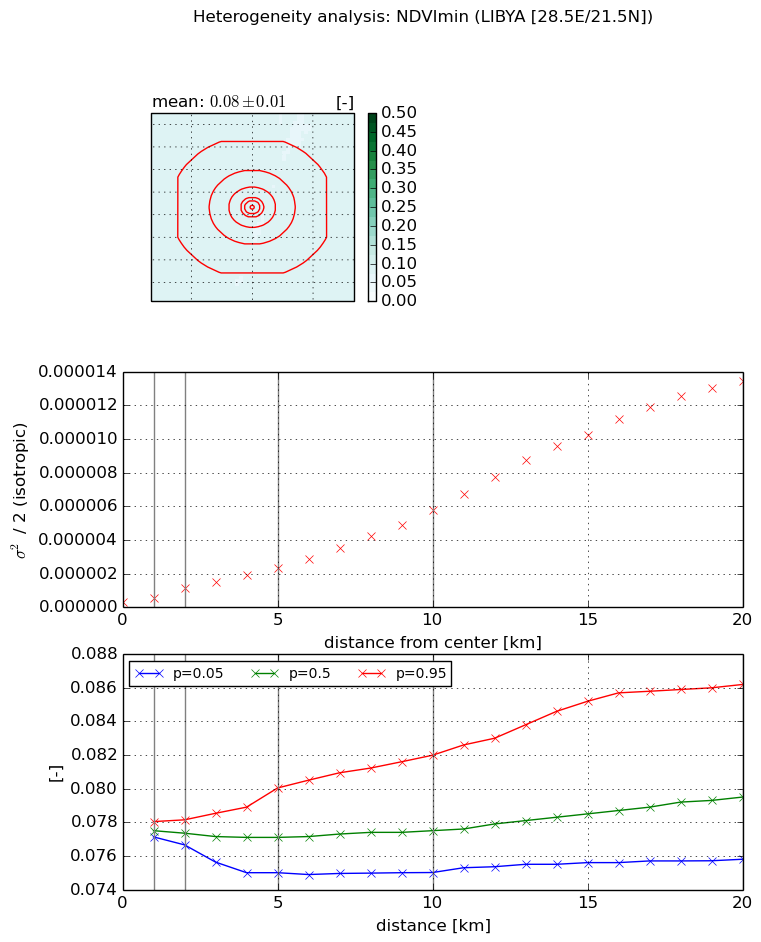
Heterogeneity analysis

The heterogeneity analysis provides information about the spatial and temporal heterogeneity of the site.

Topography


Roman et al. (2009) index


St

2.32071670152

Rcv

0.0697139486758

Rse

0.0

Rst

-0.222990658649

Rsv

-0.999999494831


Height range @ 1km [m]

18

Height range @ 2km [m]

15

Height range @ 5km [m]

16

Height range @ 10km [m]

-999

Height range @ 20km [m]

-999


Variance slope @ 1 km

3

Variance slope @ 2 km

2

Variance slope @ 5 km

2

Variance slope @ 10 km

-999

Variance slope @ 20 km

-999


NDVI (max. NDVI composite)


Roman et al. (2009) index


St

1.09282895186

Rcv

0.901804767358

Rse

0.0

Rst

2.07612146306e-10

Rsv

1.84336408515


NDVI range @ 1km [-]

0.0

NDVI range @ 2km [-]

0.0

NDVI range @ 5km [-]

0.0

NDVI range @ 10km [-]

0.01

NDVI range @ 20km [-]

0.01


Variance slope @ 1 km

1.91080982577e-07

Variance slope @ 2 km

3.2000788456e-07

Variance slope @ 5 km

3.38145794382e-07

Variance slope @ 10 km

4.69226946888e-07

Variance slope @ 20 km

6.33985805747e-07


NDVI (min. NDVI composite)I


Roman et al. (2009) index


St

0.00410542747978

Rcv

0.666023504334

Rse

0.0

Rst

1.81732795467e-08

Rsv

730.073957825


NDVI range @ 1km [-]

0.0

NDVI range @ 2km [-]

0.0

NDVI range @ 5km [-]

0.01

NDVI range @ 10km [-]

0.01

NDVI range @ 20km [-]

0.01


NDVI slope @ 1 km

2.72384793173e-07

NDVI slope @ 2 km

4.41434480022e-07

NDVI slope @ 5 km

4.1607600425e-07

NDVI slope @ 10 km

5.37429150739e-07

NDVI slope @ 20 km

7.20969897784e-07


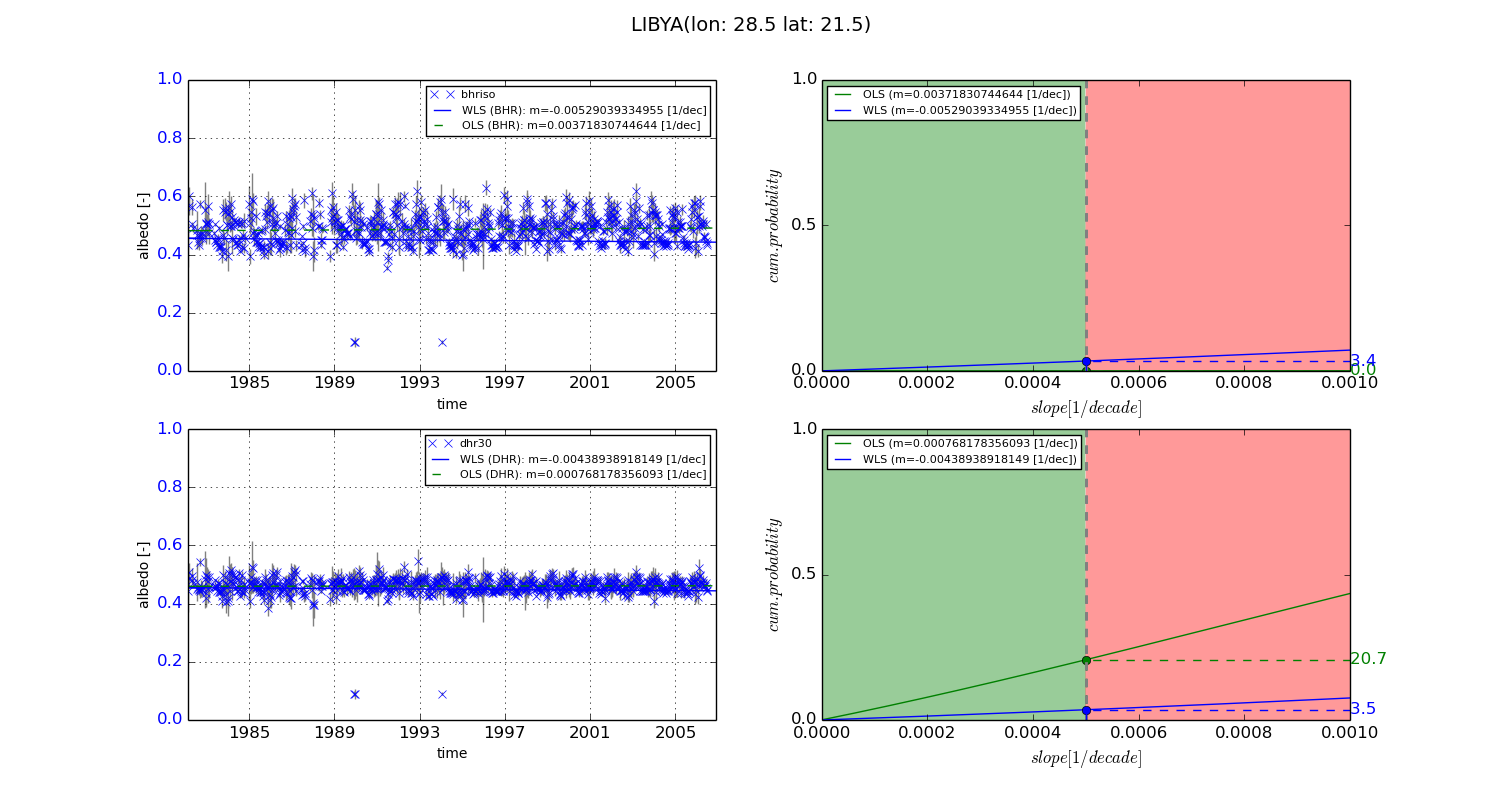
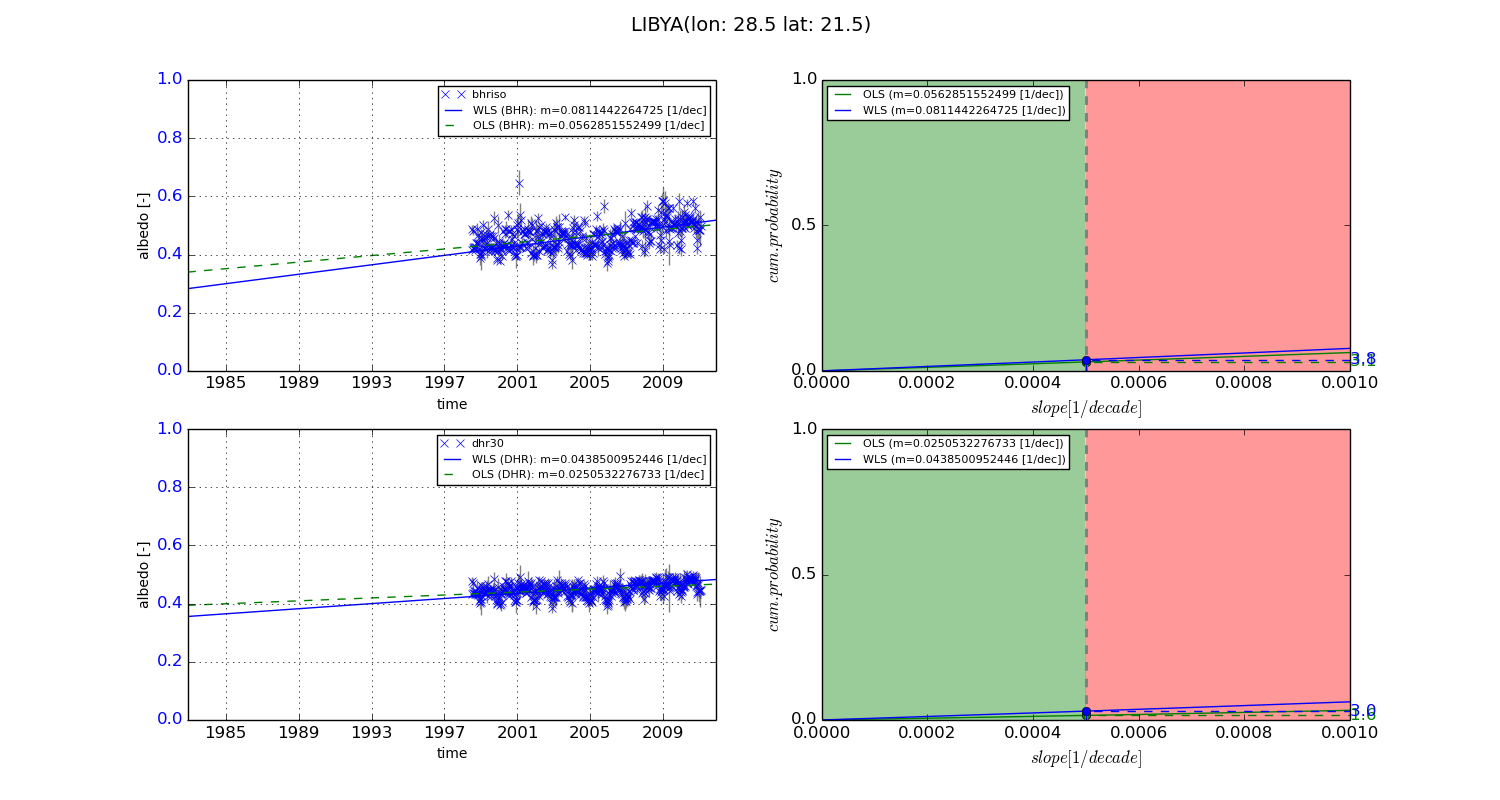
Temporal stability analysis

+000 deg (BHR)


BHR statistics

Temporal stability [1/decade]:


abs

rel


Weighted least square:

-0.00529039334955


Ordinary least square:

0.00371830744644


Probabilities that GCOS criteria is met:

Weighted least square:

3.4 %

Ordinary least square:

0.0 %


DHR statistics

Temporal stability [1/decade]:


abs

rel


Weighted least square:

-0.00438938918149


Ordinary least square:

0.000768178356093


Probabilities that GCOS criteria is met:

Weighted least square:

3.5 %

Ordinary least square:

20.7 %


+057/+063 deg (BHR)


BHR statistics

Temporal stability [1/decade]:


abs

rel


Weighted least square:

0.0811442264725


Ordinary least square:

0.0562851552499


Probabilities that GCOS criteria is met:

Weighted least square:

3.8 %

Ordinary least square:

3.1 %


DHR statistics

Temporal stability [1/decade]:


abs

rel


Weighted least square:

0.0438500952446


Ordinary least square:

0.0250532276733


Probabilities that GCOS criteria is met:

Weighted least square:

3.0 %

Ordinary least square:

1.6 %


Temporal anomaly analyis

The variance of the temporal anomalies provides an additional measure about the stability of the signal AFTER removal of the mean seasonal cylce.

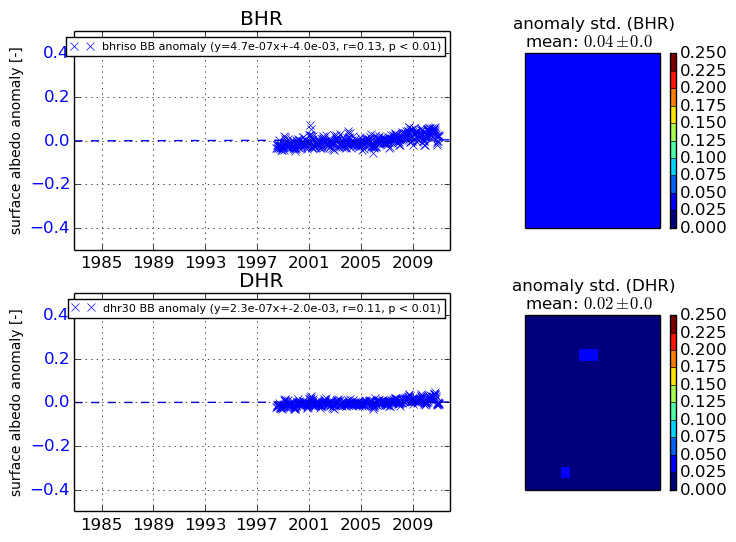
+000 deg


+057/+063 deg