LILLE


Location

lon / lat [deg]: 3.1417 / 50.6117

Source network: AERONET


Geostationary surface albedo (GSA) data


“+000”


“+057/+063”


Landcover information (based on ESA CCI landcover data)


Landcover fractions @ 2km distance


Landcover fractions @ 20 km distance


Legend


Distance to open water bodies [km]:

3.18

Distance to urban areas [km]:

0.13


Radius: 1 km

Number of landcover classes:

1

Dominant landcover type:

190: urban areas

Fraction of dominant landcover type [%]:

100.0


Radius: 2 km

Number of landcover classes:

2

Dominant landcover type:

190: urban areas

Fraction of dominant landcover type [%]:

93.0


Radius: 5 km

Number of landcover classes:

2

Dominant landcover type:

190: urban areas

Fraction of dominant landcover type [%]:

79.0


Radius: 10 km

Number of landcover classes:

3

Dominant landcover type:

190: urban areas

Fraction of dominant landcover type [%]:

68.0


Radius: 20 km

Number of landcover classes:

3

Dominant landcover type:

10: cropland, rainfed

Fraction of dominant landcover type [%]:

51.0


Disturbances


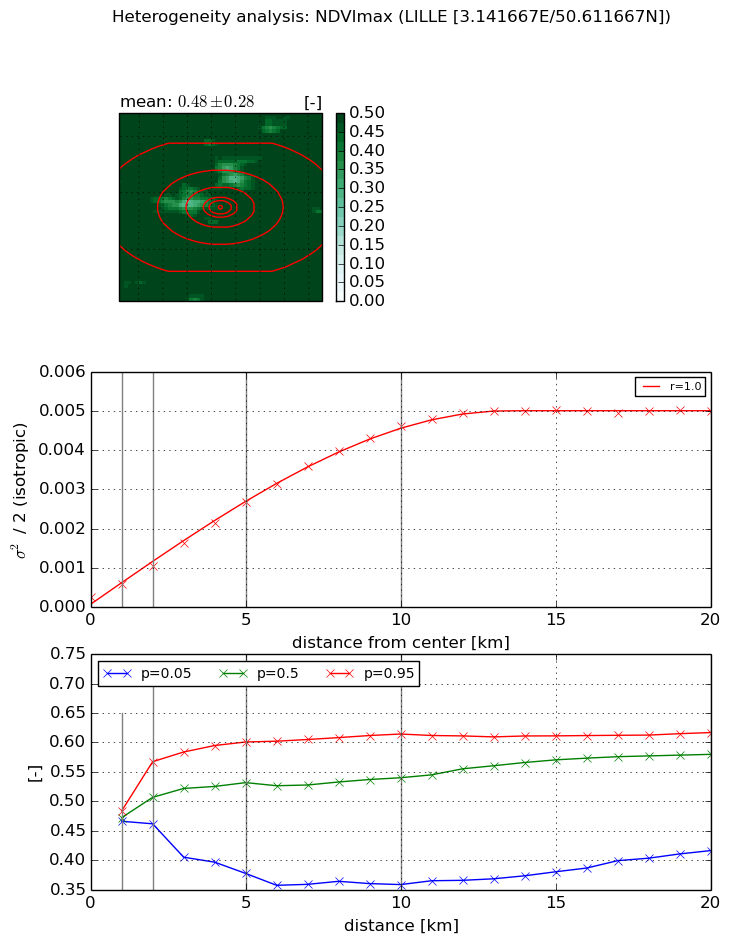
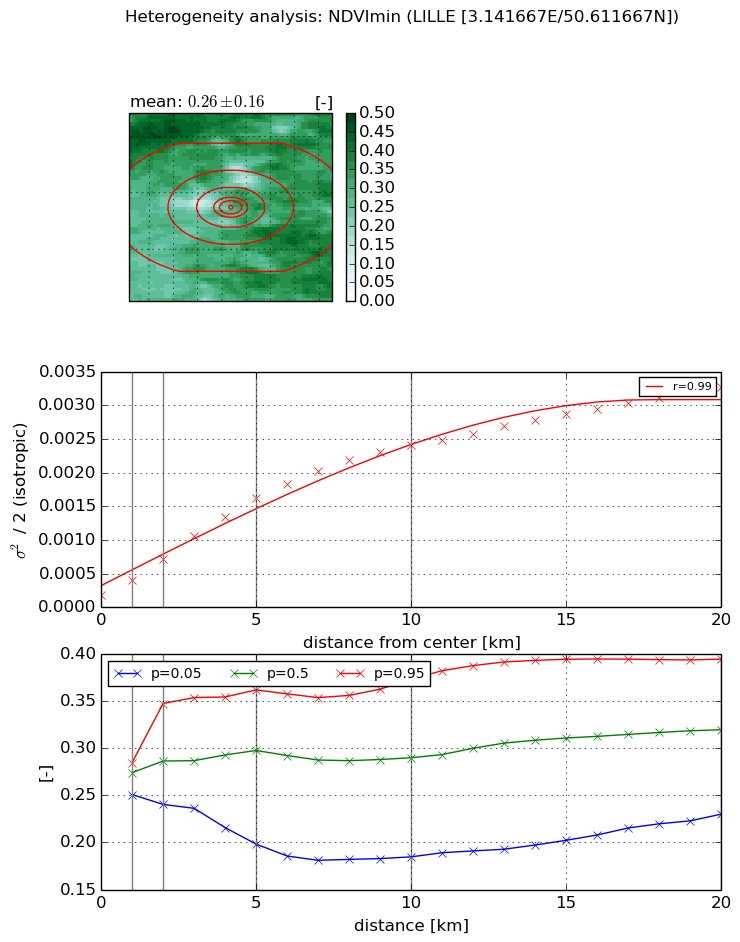
Heterogeneity analysis

The heterogeneity analysis provides information about the spatial and temporal heterogeneity of the site.

Topography


Roman et al. (2009) index


St

3.76661660139

Rcv

0.458062832397

Rse

0.0

Rst

-6.75805512191e-08

Rsv

-0.338407863437


Height range @ 1km [m]

10

Height range @ 2km [m]

15

Height range @ 5km [m]

29

Height range @ 10km [m]

-999

Height range @ 20km [m]

-999


Variance slope @ 1 km

19

Variance slope @ 2 km

17

Variance slope @ 5 km

13

Variance slope @ 10 km

-999

Variance slope @ 20 km

-999


NDVI (max. NDVI composite)


Roman et al. (2009) index


St

5.56679936008e-08

Rcv

0.309397299044

Rse

0.0

Rst

0.173035778052

Rsv

53890930.4808


NDVI range @ 1km [-]

0.02

NDVI range @ 2km [-]

0.11

NDVI range @ 5km [-]

0.22

NDVI range @ 10km [-]

0.26

NDVI range @ 20km [-]

0.2


Variance slope @ 1 km

0.000324578787161

Variance slope @ 2 km

0.000398413454328

Variance slope @ 5 km

0.000494606289579

Variance slope @ 10 km

0.000457848012018

Variance slope @ 20 km

0.000240104450252


NDVI (min. NDVI composite)I


Roman et al. (2009) index


St

2.13862509223

Rcv

0.349386893764

Rse

0.0

Rst

-0.0533849335426

Rsv

-0.999998583876


NDVI range @ 1km [-]

0.03

NDVI range @ 2km [-]

0.11

NDVI range @ 5km [-]

0.16

NDVI range @ 10km [-]

0.19

NDVI range @ 20km [-]

0.16


NDVI slope @ 1 km

0.0002198539774

NDVI slope @ 2 km

0.000261624793439

NDVI slope @ 5 km

0.000294043464202

NDVI slope @ 10 km

0.000233025167531

NDVI slope @ 20 km

0.000145177462727


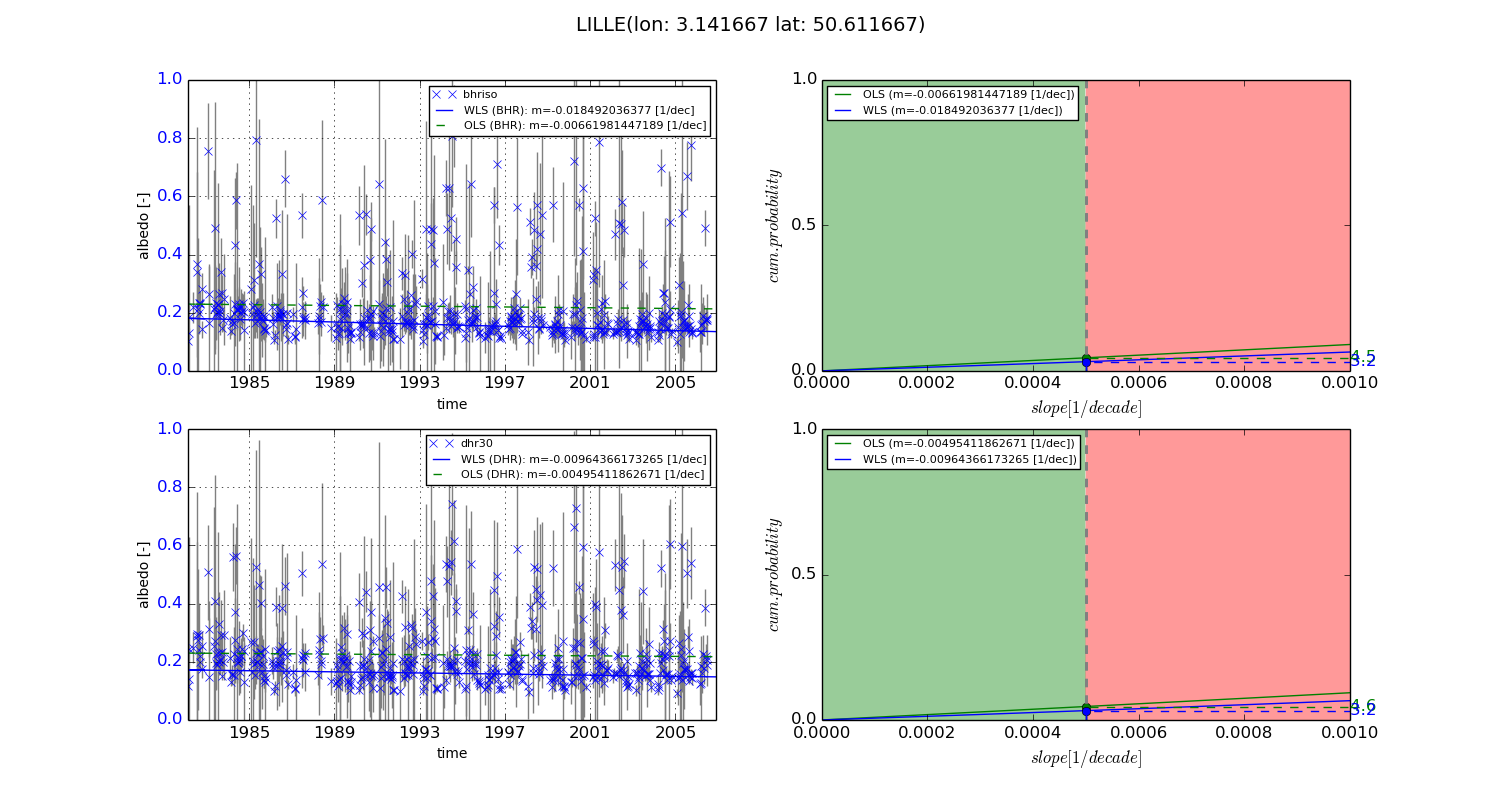
Temporal stability analysis

+000 deg (BHR)


BHR statistics

Temporal stability [1/decade]:


abs

rel


Weighted least square:

-0.018492036377


Ordinary least square:

-0.00661981447189


Probabilities that GCOS criteria is met:

Weighted least square:

3.2 %

Ordinary least square:

4.5 %


DHR statistics

Temporal stability [1/decade]:


abs

rel


Weighted least square:

-0.00964366173265


Ordinary least square:

-0.00495411862671


Probabilities that GCOS criteria is met:

Weighted least square:

3.2 %

Ordinary least square:

4.6 %


+057/+063 deg (BHR)


BHR statistics

Temporal stability [1/decade]:


abs

rel


Weighted least square:

-99999.0


Ordinary least square:

-99999.0


Probabilities that GCOS criteria is met:

Weighted least square:

-99999.0 %

Ordinary least square:

-99999.0 %


DHR statistics

Temporal stability [1/decade]:


abs

rel


Weighted least square:

-99999.0


Ordinary least square:

-99999.0


Probabilities that GCOS criteria is met:

Weighted least square:

-99999.0 %

Ordinary least square:

-99999.0 %


Temporal anomaly analyis

The variance of the temporal anomalies provides an additional measure about the stability of the signal AFTER removal of the mean seasonal cylce.
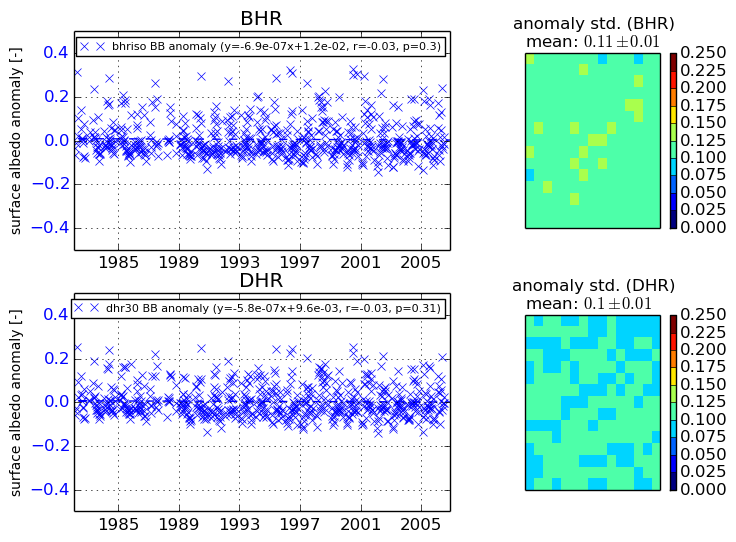
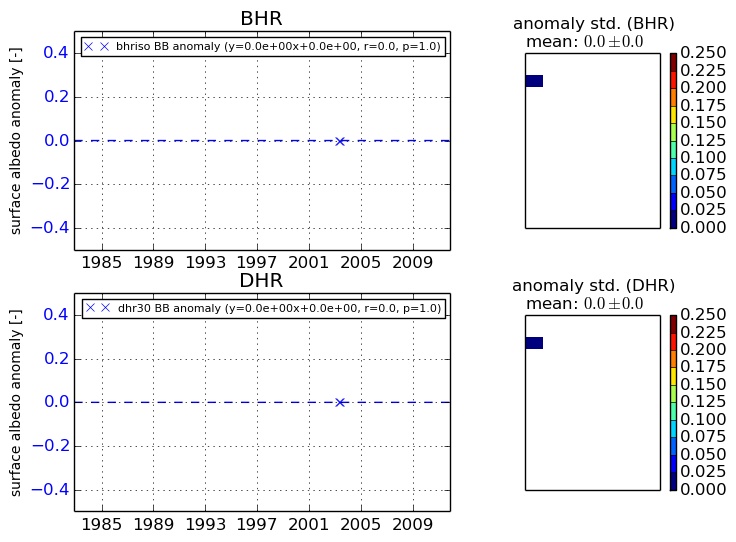
+000 deg


+057/+063 deg