LIN


Location

lon / lat [deg]: 14.122 / 52.21

Source network: BSRN


Geostationary surface albedo (GSA) data


“+000”


“+057/+063”


Landcover information (based on ESA CCI landcover data)


Landcover fractions @ 2km distance


Landcover fractions @ 20 km distance


Legend


Distance to open water bodies [km]:

5.45

Distance to urban areas [km]:

0.09


Radius: 1 km

Number of landcover classes:

2

Dominant landcover type:

10: cropland, rainfed

Fraction of dominant landcover type [%]:

74.0


Radius: 2 km

Number of landcover classes:

2

Dominant landcover type:

10: cropland, rainfed

Fraction of dominant landcover type [%]:

92.0


Radius: 5 km

Number of landcover classes:

3

Dominant landcover type:

10: cropland, rainfed

Fraction of dominant landcover type [%]:

85.0


Radius: 10 km

Number of landcover classes:

5

Dominant landcover type:

10: cropland, rainfed

Fraction of dominant landcover type [%]:

55.0


Radius: 20 km

Number of landcover classes:

8

Dominant landcover type:

70: Tree cover, needleleaved, evergreen, closed to open (>15%)

Fraction of dominant landcover type [%]:

42.0


Disturbances


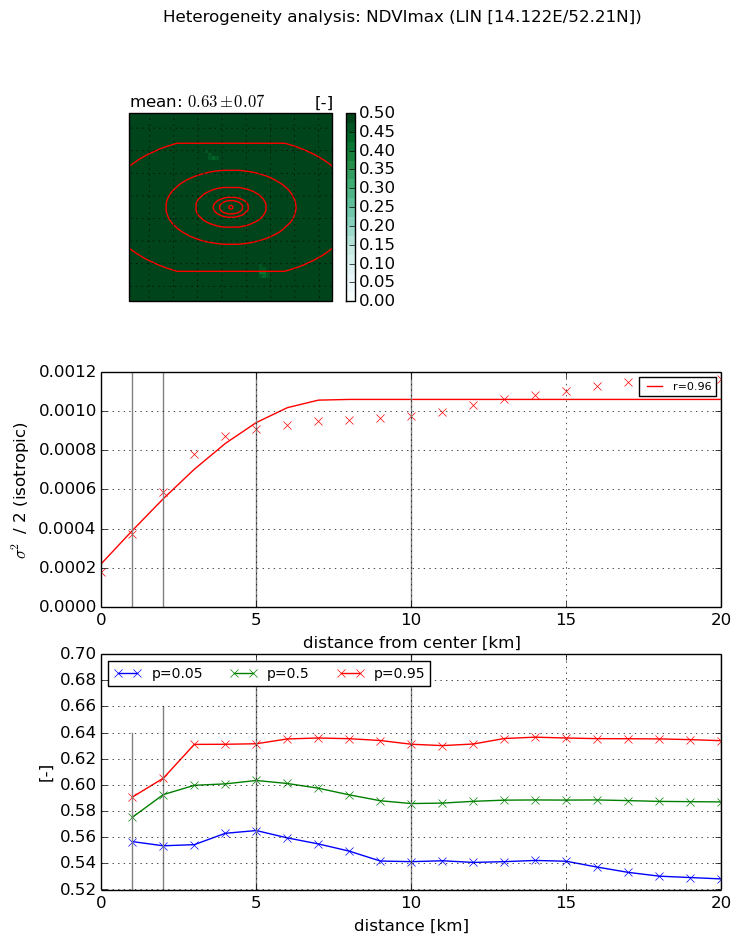
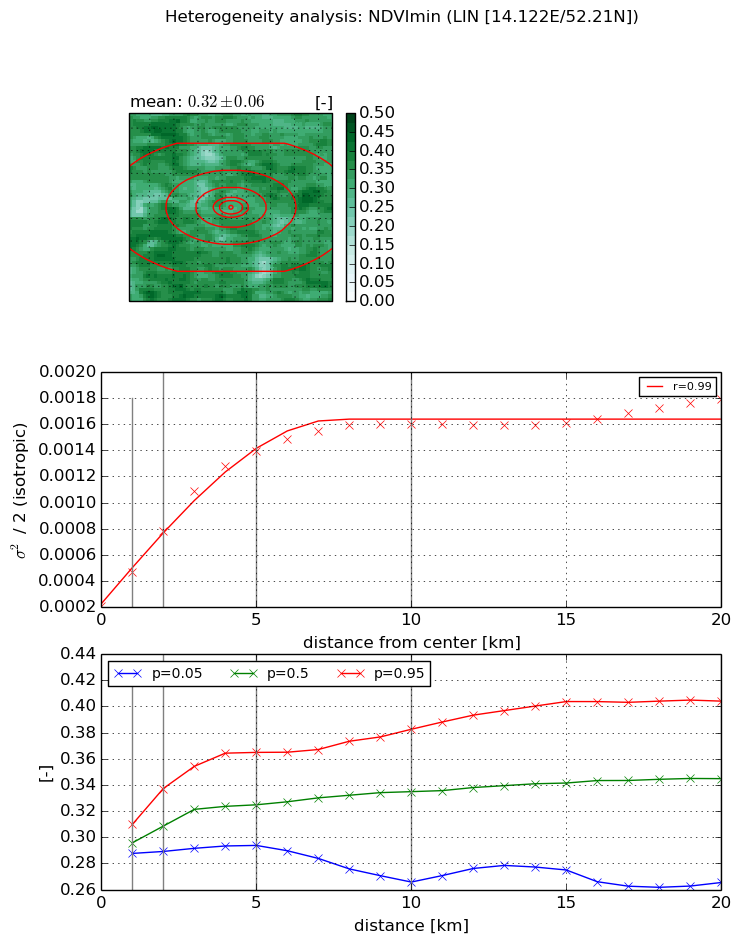
Heterogeneity analysis

The heterogeneity analysis provides information about the spatial and temporal heterogeneity of the site.

Topography


Roman et al. (2009) index


St

3.34583954861e-07

Rcv

0.675313458698

Rse

0.0

Rst

0.0222807919323

Rsv

8966358.73601


Height range @ 1km [m]

27

Height range @ 2km [m]

25

Height range @ 5km [m]

45

Height range @ 10km [m]

-999

Height range @ 20km [m]

-999


Variance slope @ 1 km

57

Variance slope @ 2 km

60

Variance slope @ 5 km

65

Variance slope @ 10 km

-999

Variance slope @ 20 km

-999


NDVI (max. NDVI composite)


Roman et al. (2009) index


St

11.3214354482

Rcv

-0.0967046848656

Rse

0.0

Rst

-0.0501635849158

Rsv

0.118115796394


NDVI range @ 1km [-]

0.03

NDVI range @ 2km [-]

0.05

NDVI range @ 5km [-]

0.07

NDVI range @ 10km [-]

0.09

NDVI range @ 20km [-]

0.11


Variance slope @ 1 km

0.000190137891735

Variance slope @ 2 km

0.000203884865109

Variance slope @ 5 km

0.000152141978825

Variance slope @ 10 km

7.11652652899e-05

Variance slope @ 20 km

3.57625589184e-05


NDVI (min. NDVI composite)I


Roman et al. (2009) index


St

nan

Rcv

nan

Rse

nan

Rst

nan

Rsv

nan


NDVI range @ 1km [-]

0.02

NDVI range @ 2km [-]

0.05

NDVI range @ 5km [-]

0.07

NDVI range @ 10km [-]

0.12

NDVI range @ 20km [-]

0.14


NDVI slope @ 1 km

0.000258823054315

NDVI slope @ 2 km

0.000285424727185

NDVI slope @ 5 km

0.000246943532128

NDVI slope @ 10 km

0.000136905227629

NDVI slope @ 20 km

5.58899831018e-05


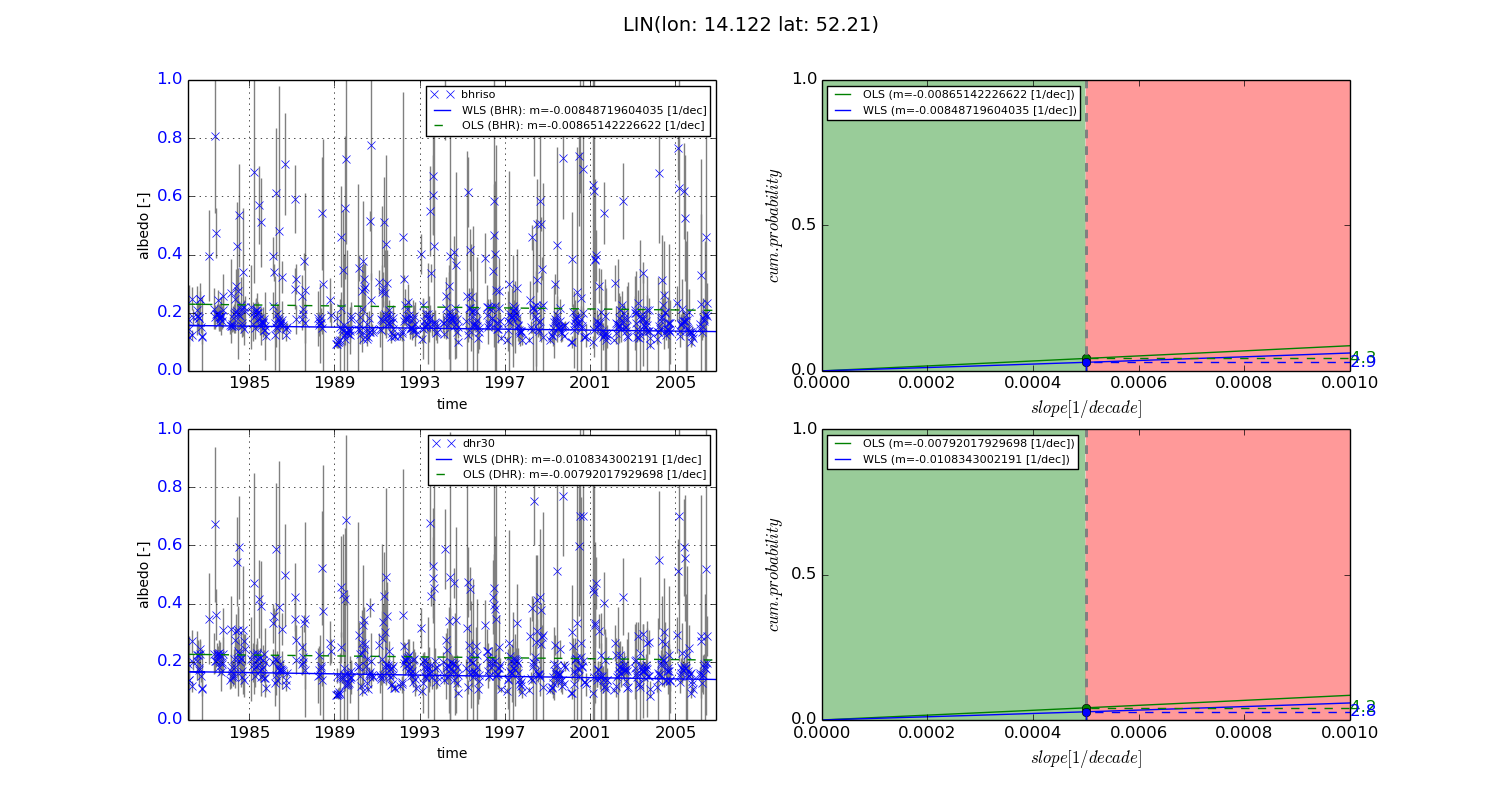
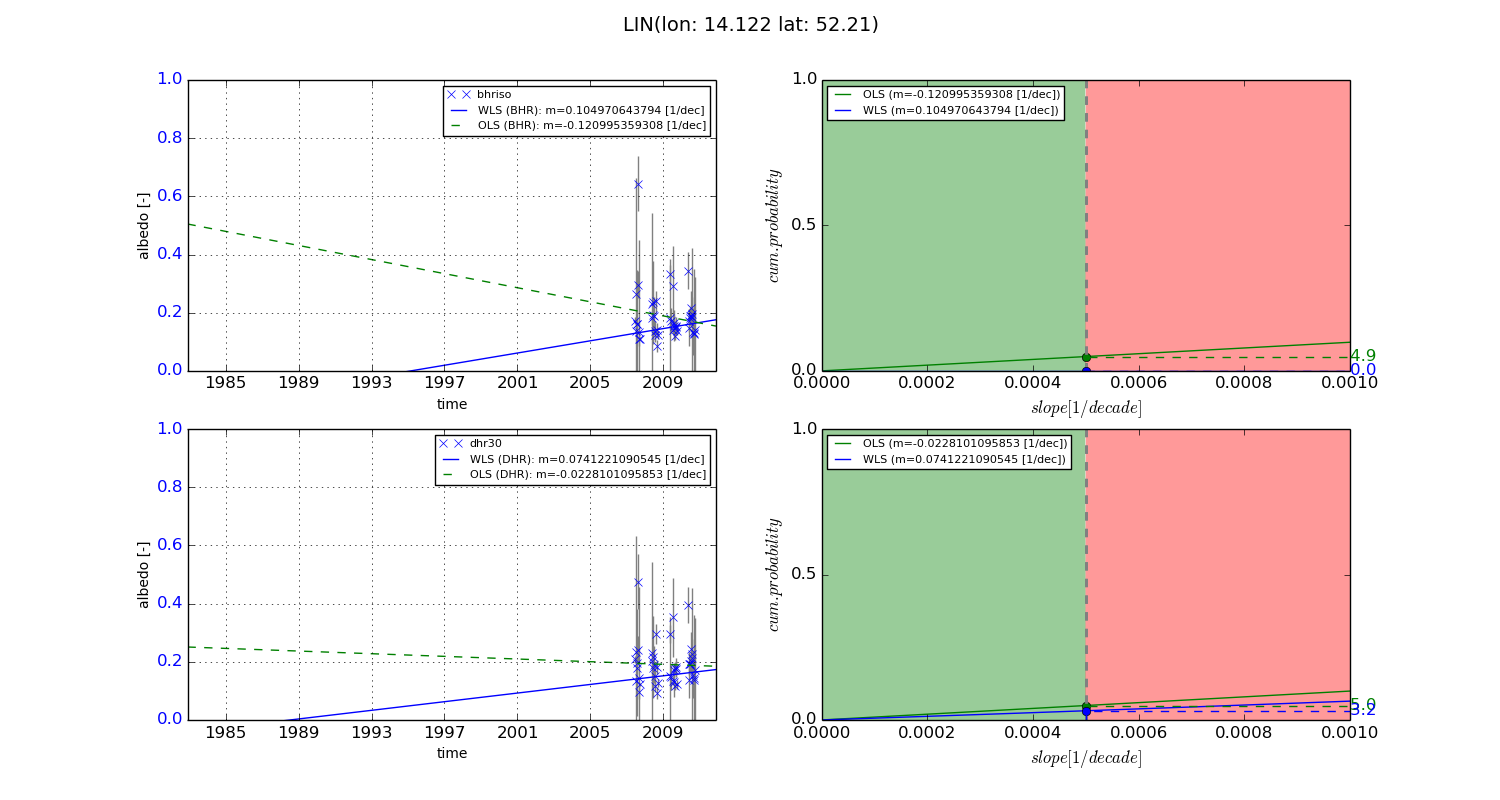
Temporal stability analysis

+000 deg (BHR)


BHR statistics

Temporal stability [1/decade]:


abs

rel


Weighted least square:

-0.00848719604035


Ordinary least square:

-0.00865142226622


Probabilities that GCOS criteria is met:

Weighted least square:

2.9 %

Ordinary least square:

4.3 %


DHR statistics

Temporal stability [1/decade]:


abs

rel


Weighted least square:

-0.0108343002191


Ordinary least square:

-0.00792017929698


Probabilities that GCOS criteria is met:

Weighted least square:

2.8 %

Ordinary least square:

4.2 %


+057/+063 deg (BHR)


BHR statistics

Temporal stability [1/decade]:


abs

rel


Weighted least square:

0.104970643794


Ordinary least square:

-0.120995359308


Probabilities that GCOS criteria is met:

Weighted least square:

0.0 %

Ordinary least square:

4.9 %


DHR statistics

Temporal stability [1/decade]:


abs

rel


Weighted least square:

0.0741221090545


Ordinary least square:

-0.0228101095853


Probabilities that GCOS criteria is met:

Weighted least square:

3.2 %

Ordinary least square:

5.0 %


Temporal anomaly analyis

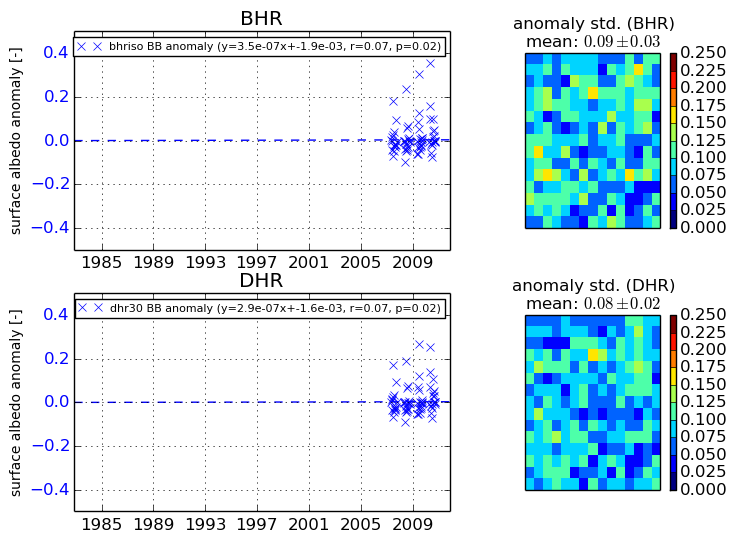
The variance of the temporal anomalies provides an additional measure about the stability of the signal AFTER removal of the mean seasonal cylce.
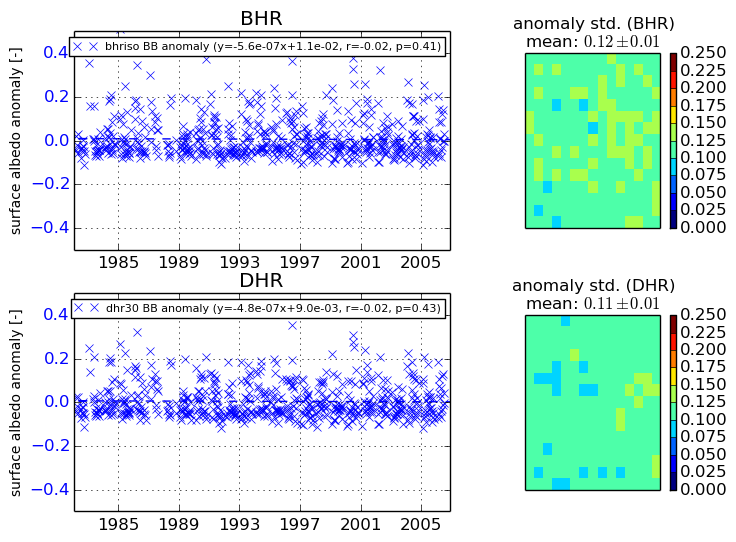
+000 deg


+057/+063 deg