LITANG


Location

lon / lat [deg]: 100.2618 / 29.9763

Source network: AERONET


Geostationary surface albedo (GSA) data


“+000”


“+057/+063”


Landcover information (based on ESA CCI landcover data)


Landcover fractions @ 2km distance


Landcover fractions @ 20 km distance


Legend


Distance to open water bodies [km]:

13.31

Distance to urban areas [km]:

4.65


Radius: 1 km

Number of landcover classes:

5

Dominant landcover type:

130: grassland

Fraction of dominant landcover type [%]:

59.0


Radius: 2 km

Number of landcover classes:

5

Dominant landcover type:

130: grassland

Fraction of dominant landcover type [%]:

62.0


Radius: 5 km

Number of landcover classes:

5

Dominant landcover type:

130: grassland

Fraction of dominant landcover type [%]:

66.0


Radius: 10 km

Number of landcover classes:

5

Dominant landcover type:

130: grassland

Fraction of dominant landcover type [%]:

73.0


Radius: 20 km

Number of landcover classes:

6

Dominant landcover type:

130: grassland

Fraction of dominant landcover type [%]:

79.0


Disturbances


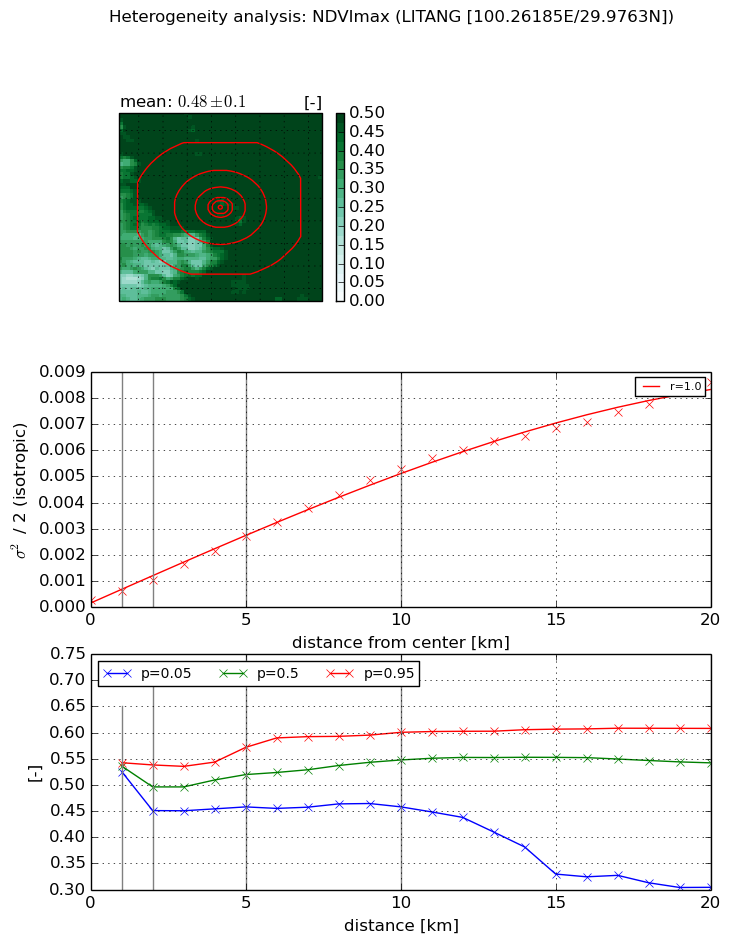
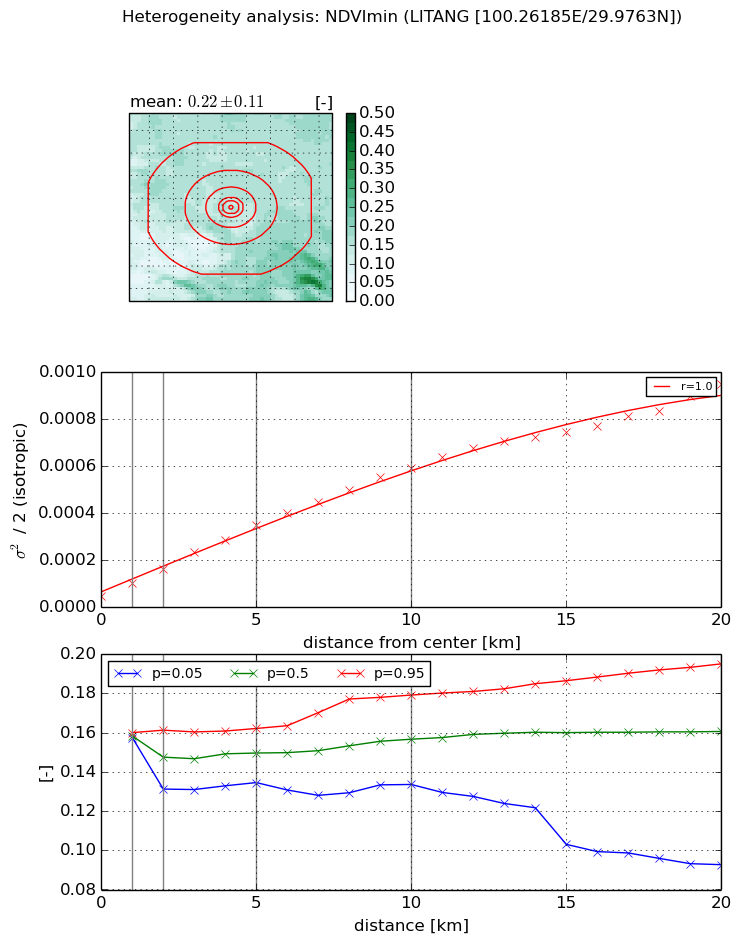
Heterogeneity analysis

The heterogeneity analysis provides information about the spatial and temporal heterogeneity of the site.

Topography


Roman et al. (2009) index


St

1.09687488777

Rcv

1.75133348759

Rse

0.0

Rst

-1.30567667212e-06

Rsv

-0.983708221627


Height range @ 1km [m]

9

Height range @ 2km [m]

22

Height range @ 5km [m]

135

Height range @ 10km [m]

-999

Height range @ 20km [m]

-999


Variance slope @ 1 km

787

Variance slope @ 2 km

792

Variance slope @ 5 km

670

Variance slope @ 10 km

-999

Variance slope @ 20 km

-999


NDVI (max. NDVI composite)


Roman et al. (2009) index


St

1.41673497818

Rcv

0.111777796406

Rse

0.0

Rst

-0.535324814438

Rsv

1.47044234019


NDVI range @ 1km [-]

0.02

NDVI range @ 2km [-]

0.09

NDVI range @ 5km [-]

0.11

NDVI range @ 10km [-]

0.14

NDVI range @ 20km [-]

0.3


Variance slope @ 1 km

0.000329482380227

Variance slope @ 2 km

0.000372582136687

Variance slope @ 5 km

0.000496627978243

Variance slope @ 10 km

0.000521217904593

Variance slope @ 20 km

0.000418220587912


NDVI (min. NDVI composite)I


Roman et al. (2009) index


St

nan

Rcv

nan

Rse

nan

Rst

nan

Rsv

nan


NDVI range @ 1km [-]

0.0

NDVI range @ 2km [-]

0.03

NDVI range @ 5km [-]

0.03

NDVI range @ 10km [-]

0.05

NDVI range @ 20km [-]

0.1


NDVI slope @ 1 km

5.32758912633e-05

NDVI slope @ 2 km

5.6040066999e-05

NDVI slope @ 5 km

6.05521647204e-05

NDVI slope @ 10 km

5.51822382409e-05

NDVI slope @ 20 km

4.28520794177e-05


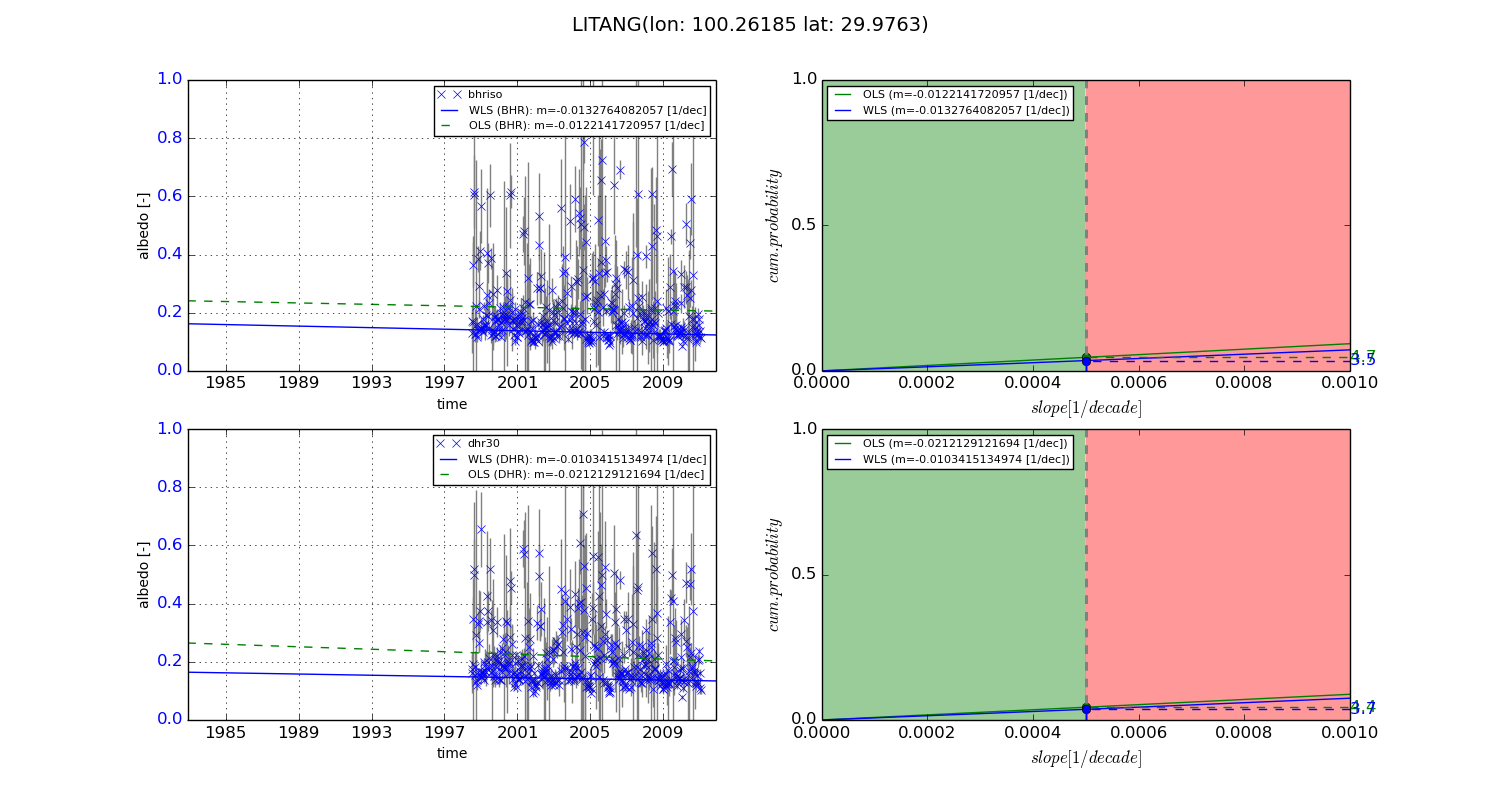
Temporal stability analysis

+000 deg (BHR)


BHR statistics

Temporal stability [1/decade]:


abs

rel


Weighted least square:

None


Ordinary least square:

None


Probabilities that GCOS criteria is met:

Weighted least square:

None %

Ordinary least square:

None %


DHR statistics

Temporal stability [1/decade]:


abs

rel


Weighted least square:

None


Ordinary least square:

None


Probabilities that GCOS criteria is met:

Weighted least square:

None %

Ordinary least square:

None %


+057/+063 deg (BHR)


BHR statistics

Temporal stability [1/decade]:


abs

rel


Weighted least square:

-0.0132764082057


Ordinary least square:

-0.0122141720957


Probabilities that GCOS criteria is met:

Weighted least square:

3.5 %

Ordinary least square:

4.7 %


DHR statistics

Temporal stability [1/decade]:


abs

rel


Weighted least square:

-0.0103415134974


Ordinary least square:

-0.0212129121694


Probabilities that GCOS criteria is met:

Weighted least square:

3.7 %

Ordinary least square:

4.4 %


Temporal anomaly analyis

The variance of the temporal anomalies provides an additional measure about the stability of the signal AFTER removal of the mean seasonal cylce.

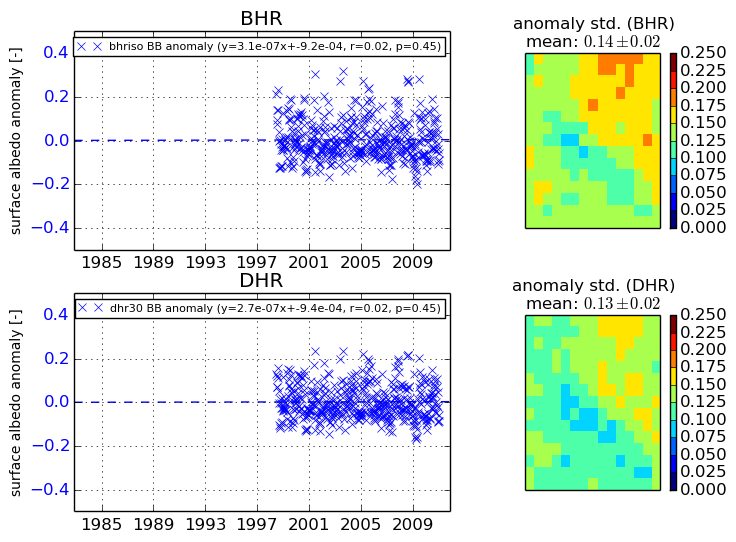
+000 deg


+057/+063 deg