LONDON-UCL-UAO


Location

lon / lat [deg]: -0.1311 / 51.5243

Source network: AERONET


Geostationary surface albedo (GSA) data


“+000”


“+057/+063”


Landcover information (based on ESA CCI landcover data)


Landcover fractions @ 2km distance


Landcover fractions @ 20 km distance


Legend


Distance to open water bodies [km]:

2.06

Distance to urban areas [km]:

0.09


Radius: 1 km

Number of landcover classes:

1

Dominant landcover type:

190: urban areas

Fraction of dominant landcover type [%]:

100.0


Radius: 2 km

Number of landcover classes:

1

Dominant landcover type:

190: urban areas

Fraction of dominant landcover type [%]:

100.0


Radius: 5 km

Number of landcover classes:

2

Dominant landcover type:

190: urban areas

Fraction of dominant landcover type [%]:

98.0


Radius: 10 km

Number of landcover classes:

2

Dominant landcover type:

190: urban areas

Fraction of dominant landcover type [%]:

97.0


Radius: 20 km

Number of landcover classes:

4

Dominant landcover type:

190: urban areas

Fraction of dominant landcover type [%]:

93.0


Disturbances


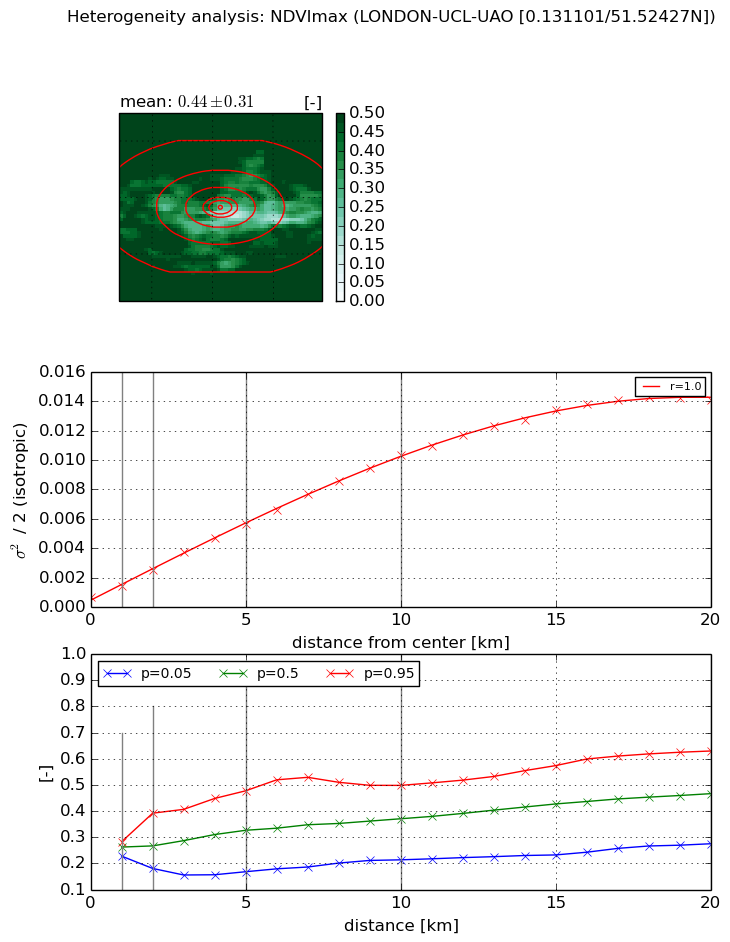
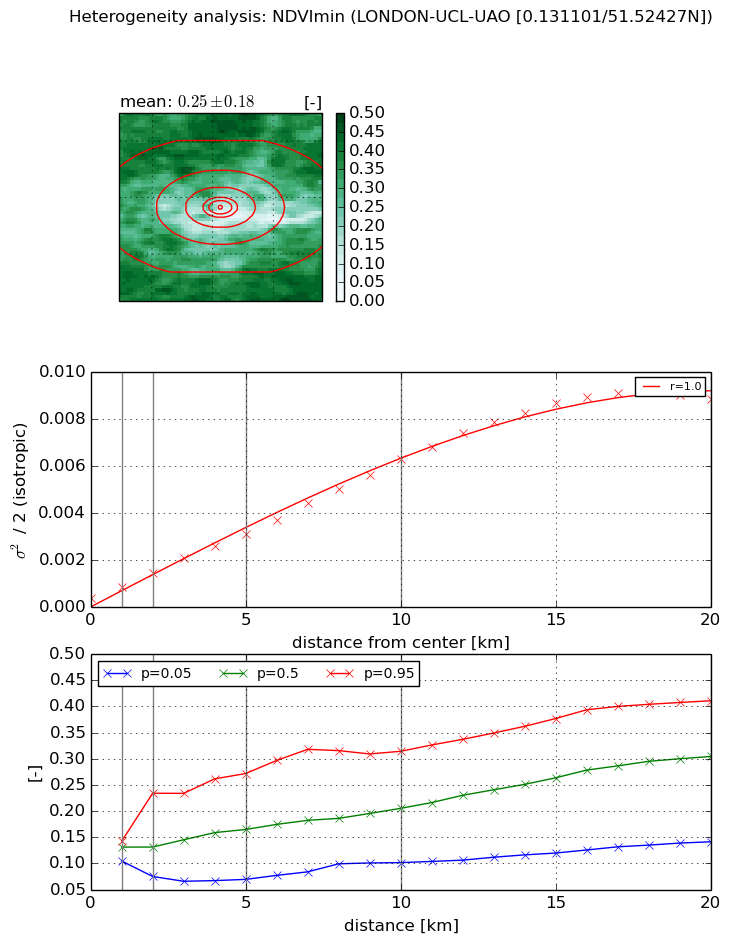
Heterogeneity analysis

The heterogeneity analysis provides information about the spatial and temporal heterogeneity of the site.

Topography


Roman et al. (2009) index


St

1.65928293852

Rcv

0.822987086713

Rse

0.0

Rst

-1.89329226435e-07

Rsv

-0.985022636169


Height range @ 1km [m]

16

Height range @ 2km [m]

19

Height range @ 5km [m]

56

Height range @ 10km [m]

-999

Height range @ 20km [m]

-999


Variance slope @ 1 km

74

Variance slope @ 2 km

84

Variance slope @ 5 km

88

Variance slope @ 10 km

-999

Variance slope @ 20 km

-999


NDVI (max. NDVI composite)


Roman et al. (2009) index


St

9.08870004152e-08

Rcv

0.00778039180449

Rse

0.0

Rst

0.0814823602532

Rsv

33008020.709


NDVI range @ 1km [-]

0.06

NDVI range @ 2km [-]

0.21

NDVI range @ 5km [-]

0.31

NDVI range @ 10km [-]

0.28

NDVI range @ 20km [-]

0.35


Variance slope @ 1 km

0.00076015691568

Variance slope @ 2 km

0.000927850352795

Variance slope @ 5 km

0.00102590627941

Variance slope @ 10 km

0.000985782399432

Variance slope @ 20 km

0.000721803507324


NDVI (min. NDVI composite)I


Roman et al. (2009) index


St

1.44402336884e-07

Rcv

-0.0294397936488

Rse

0.0

Rst

0.0213389904488

Rsv

20775287.003


NDVI range @ 1km [-]

0.04

NDVI range @ 2km [-]

0.16

NDVI range @ 5km [-]

0.2

NDVI range @ 10km [-]

0.21

NDVI range @ 20km [-]

0.27


NDVI slope @ 1 km

0.000441696402446

NDVI slope @ 2 km

0.000526680358119

NDVI slope @ 5 km

0.000556312016796

NDVI slope @ 10 km

0.000591797999823

NDVI slope @ 20 km

0.000479006749817


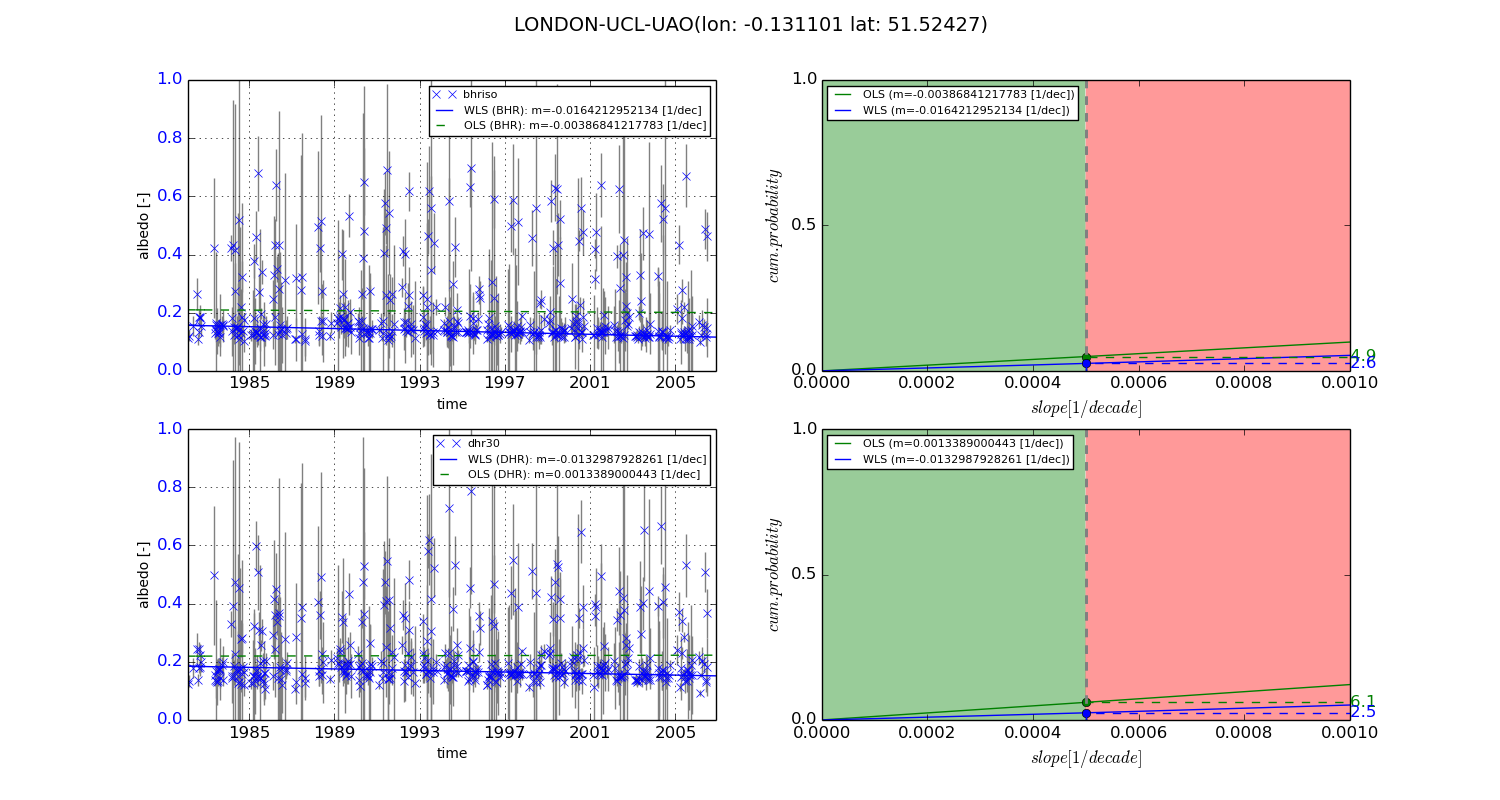
Temporal stability analysis

+000 deg (BHR)


BHR statistics

Temporal stability [1/decade]:


abs

rel


Weighted least square:

-0.0164212952134


Ordinary least square:

-0.00386841217783


Probabilities that GCOS criteria is met:

Weighted least square:

2.6 %

Ordinary least square:

4.9 %


DHR statistics

Temporal stability [1/decade]:


abs

rel


Weighted least square:

-0.0132987928261


Ordinary least square:

0.0013389000443


Probabilities that GCOS criteria is met:

Weighted least square:

2.5 %

Ordinary least square:

6.1 %


+057/+063 deg (BHR)


BHR statistics

Temporal stability [1/decade]:


abs

rel


Weighted least square:

-99999.0


Ordinary least square:

-99999.0


Probabilities that GCOS criteria is met:

Weighted least square:

-99999.0 %

Ordinary least square:

-99999.0 %


DHR statistics

Temporal stability [1/decade]:


abs

rel


Weighted least square:

-99999.0


Ordinary least square:

-99999.0


Probabilities that GCOS criteria is met:

Weighted least square:

-99999.0 %

Ordinary least square:

-99999.0 %


Temporal anomaly analyis

The variance of the temporal anomalies provides an additional measure about the stability of the signal AFTER removal of the mean seasonal cylce.
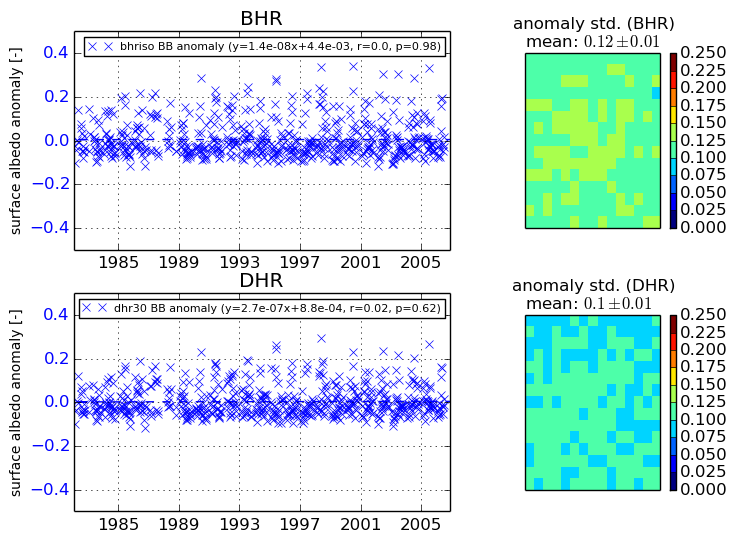
+000 deg


+057/+063 deg