LONDON


Location

lon / lat [deg]: -0.143 / 51.501

Source network: ALBEDOVAL2


Geostationary surface albedo (GSA) data


“+000”


“+057/+063”


Landcover information (based on ESA CCI landcover data)


Landcover fractions @ 2km distance


Landcover fractions @ 20 km distance


Legend


Distance to open water bodies [km]:

1.37

Distance to urban areas [km]:

0.04


Radius: 1 km

Number of landcover classes:

1

Dominant landcover type:

190: urban areas

Fraction of dominant landcover type [%]:

100.0


Radius: 2 km

Number of landcover classes:

2

Dominant landcover type:

190: urban areas

Fraction of dominant landcover type [%]:

90.0


Radius: 5 km

Number of landcover classes:

2

Dominant landcover type:

190: urban areas

Fraction of dominant landcover type [%]:

97.0


Radius: 10 km

Number of landcover classes:

2

Dominant landcover type:

190: urban areas

Fraction of dominant landcover type [%]:

98.0


Radius: 20 km

Number of landcover classes:

4

Dominant landcover type:

190: urban areas

Fraction of dominant landcover type [%]:

95.0


Disturbances


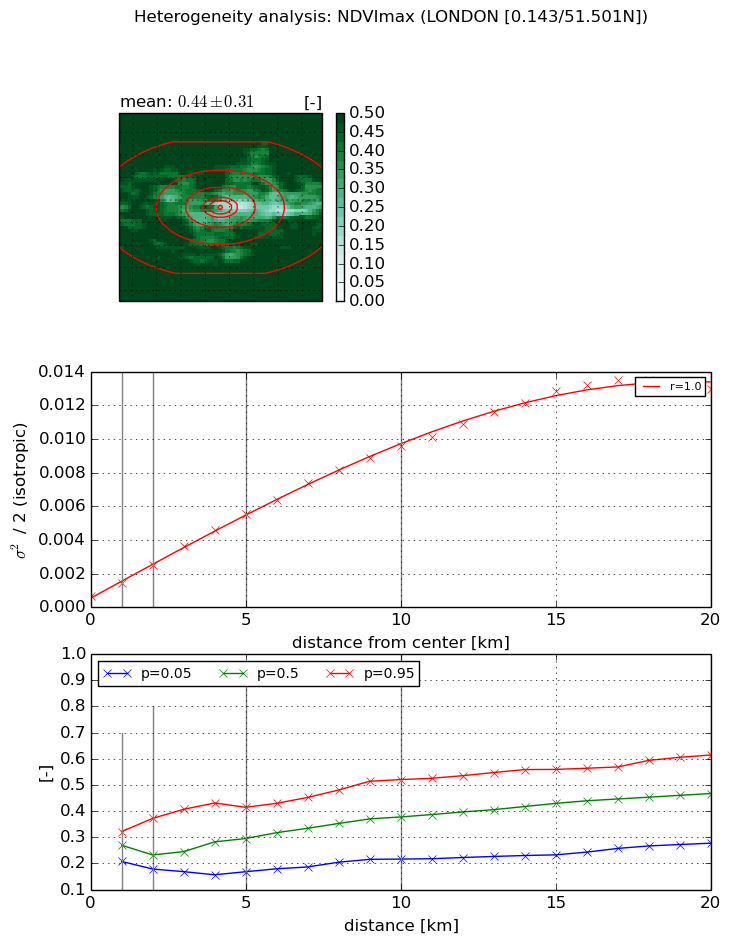
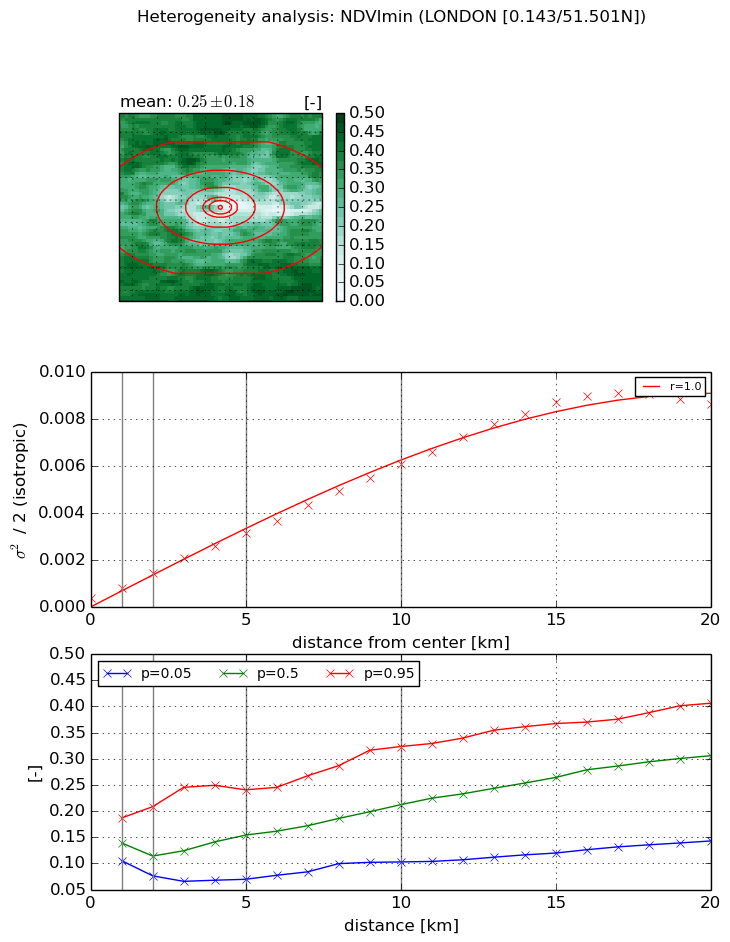
Heterogeneity analysis

The heterogeneity analysis provides information about the spatial and temporal heterogeneity of the site.

Topography


Roman et al. (2009) index


St

2.79576849433

Rcv

0.0434526880972

Rse

0.0

Rst

-0.0299932087663

Rsv

-0.999604323883


Height range @ 1km [m]

22

Height range @ 2km [m]

31

Height range @ 5km [m]

35

Height range @ 10km [m]

-999

Height range @ 20km [m]

-999


Variance slope @ 1 km

37

Variance slope @ 2 km

36

Variance slope @ 5 km

36

Variance slope @ 10 km

-999

Variance slope @ 20 km

-999


NDVI (max. NDVI composite)


Roman et al. (2009) index


St

3.64394760542e-07

Rcv

-0.144833832411

Rse

0.0

Rst

0.248970663292

Rsv

8232829.28668


NDVI range @ 1km [-]

0.11

NDVI range @ 2km [-]

0.19

NDVI range @ 5km [-]

0.25

NDVI range @ 10km [-]

0.3

NDVI range @ 20km [-]

0.34


Variance slope @ 1 km

0.000738052859302

Variance slope @ 2 km

0.000906065569679

Variance slope @ 5 km

0.00099964320626

Variance slope @ 10 km

0.000915885895626

Variance slope @ 20 km

0.000672857562428


NDVI (min. NDVI composite)I


Roman et al. (2009) index


St

4.1663499798e-07

Rcv

-0.216764555254

Rse

0.0

Rst

0.440448490533

Rsv

7200546.61929


NDVI range @ 1km [-]

0.08

NDVI range @ 2km [-]

0.13

NDVI range @ 5km [-]

0.17

NDVI range @ 10km [-]

0.22

NDVI range @ 20km [-]

0.26


NDVI slope @ 1 km

0.000435001402865

NDVI slope @ 2 km

0.000523040277815

NDVI slope @ 5 km

0.000559188840095

NDVI slope @ 10 km

0.000573998053387

NDVI slope @ 20 km

0.000473368742688


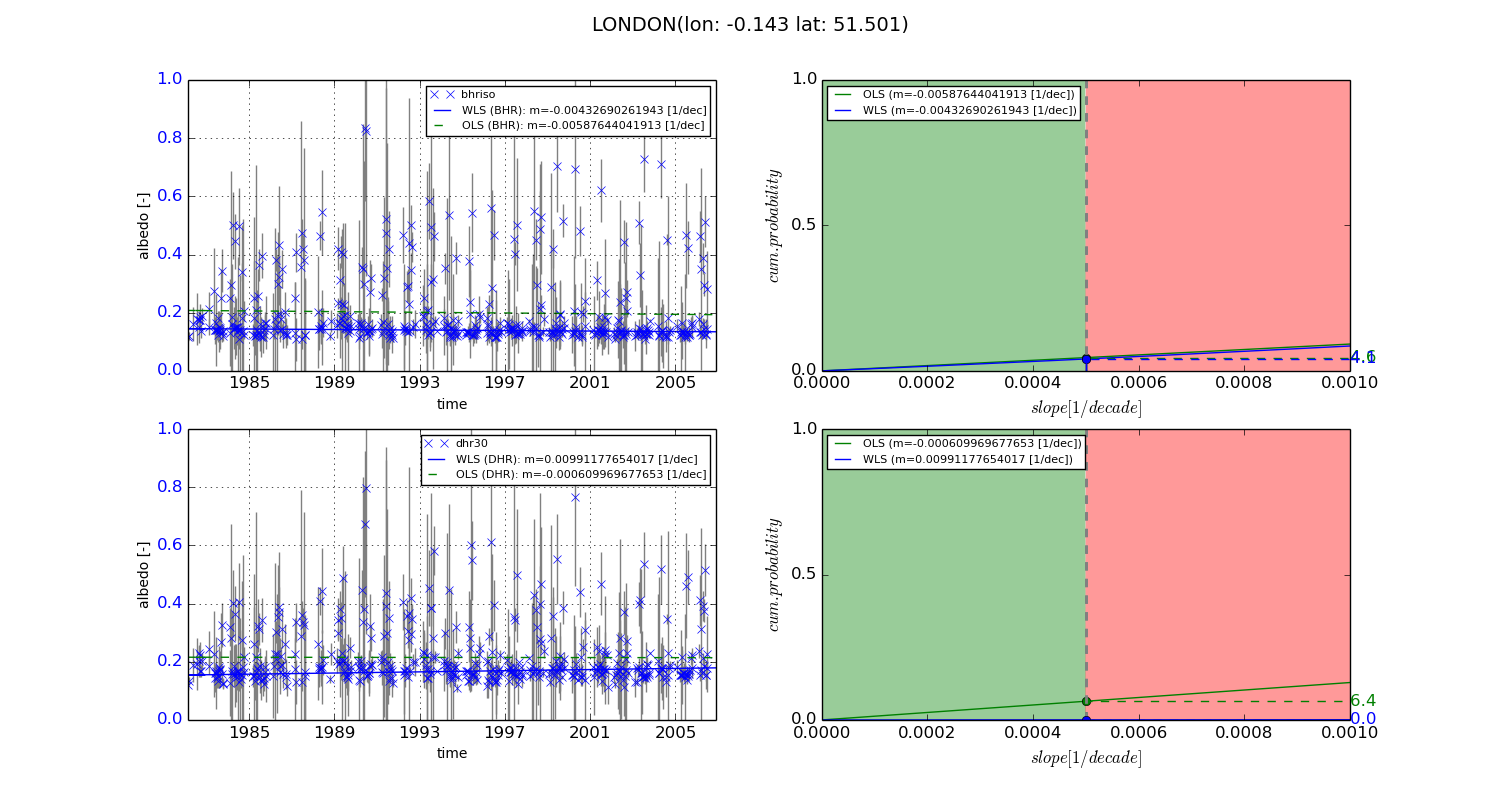
Temporal stability analysis

+000 deg (BHR)


BHR statistics

Temporal stability [1/decade]:


abs

rel


Weighted least square:

-0.00432690261943


Ordinary least square:

-0.00587644041913


Probabilities that GCOS criteria is met:

Weighted least square:

4.1 %

Ordinary least square:

4.6 %


DHR statistics

Temporal stability [1/decade]:


abs

rel


Weighted least square:

0.00991177654017


Ordinary least square:

-0.000609969677653


Probabilities that GCOS criteria is met:

Weighted least square:

0.0 %

Ordinary least square:

6.4 %


+057/+063 deg (BHR)


BHR statistics

Temporal stability [1/decade]:


abs

rel


Weighted least square:

-99999.0


Ordinary least square:

-99999.0


Probabilities that GCOS criteria is met:

Weighted least square:

-99999.0 %

Ordinary least square:

-99999.0 %


DHR statistics

Temporal stability [1/decade]:


abs

rel


Weighted least square:

-99999.0


Ordinary least square:

-99999.0


Probabilities that GCOS criteria is met:

Weighted least square:

-99999.0 %

Ordinary least square:

-99999.0 %


Temporal anomaly analyis

The variance of the temporal anomalies provides an additional measure about the stability of the signal AFTER removal of the mean seasonal cylce.
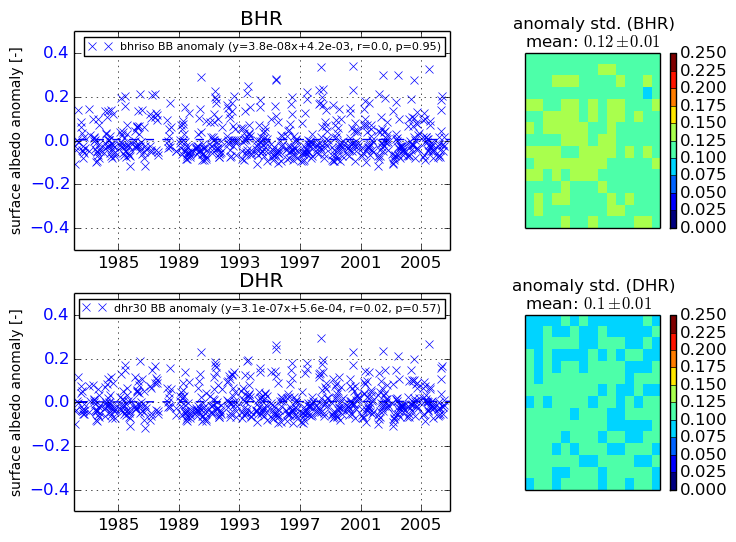
+000 deg


+057/+063 deg