LOSKOP_DAM


Location

lon / lat [deg]: 29.3516 / -25.4076

Source network: AERONET


Geostationary surface albedo (GSA) data


“+000”


“+057/+063”


Landcover information (based on ESA CCI landcover data)


Landcover fractions @ 2km distance


Landcover fractions @ 20 km distance


Legend


Distance to open water bodies [km]:

1.2

Distance to urban areas [km]:

9.68


Radius: 1 km

Number of landcover classes:

2

Dominant landcover type:

120: Shrubland

Fraction of dominant landcover type [%]:

75.0


Radius: 2 km

Number of landcover classes:

4

Dominant landcover type:

120: Shrubland

Fraction of dominant landcover type [%]:

62.0


Radius: 5 km

Number of landcover classes:

7

Dominant landcover type:

120: Shrubland

Fraction of dominant landcover type [%]:

36.0


Radius: 10 km

Number of landcover classes:

8

Dominant landcover type:

120: Shrubland

Fraction of dominant landcover type [%]:

27.0


Radius: 20 km

Number of landcover classes:

9

Dominant landcover type:

10: cropland, rainfed

Fraction of dominant landcover type [%]:

24.0


Disturbances


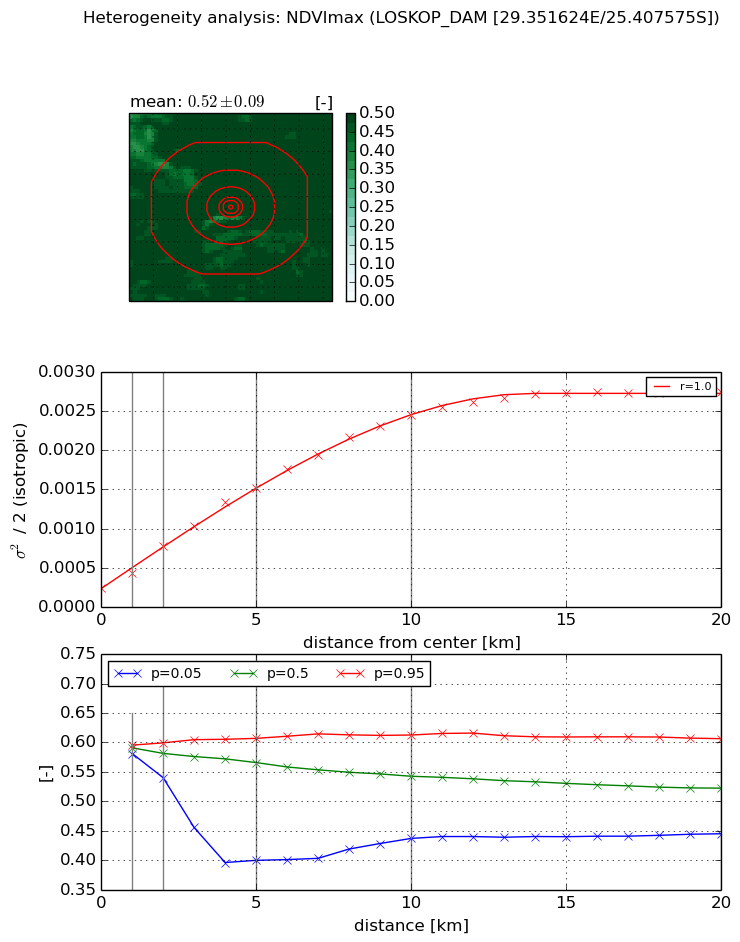
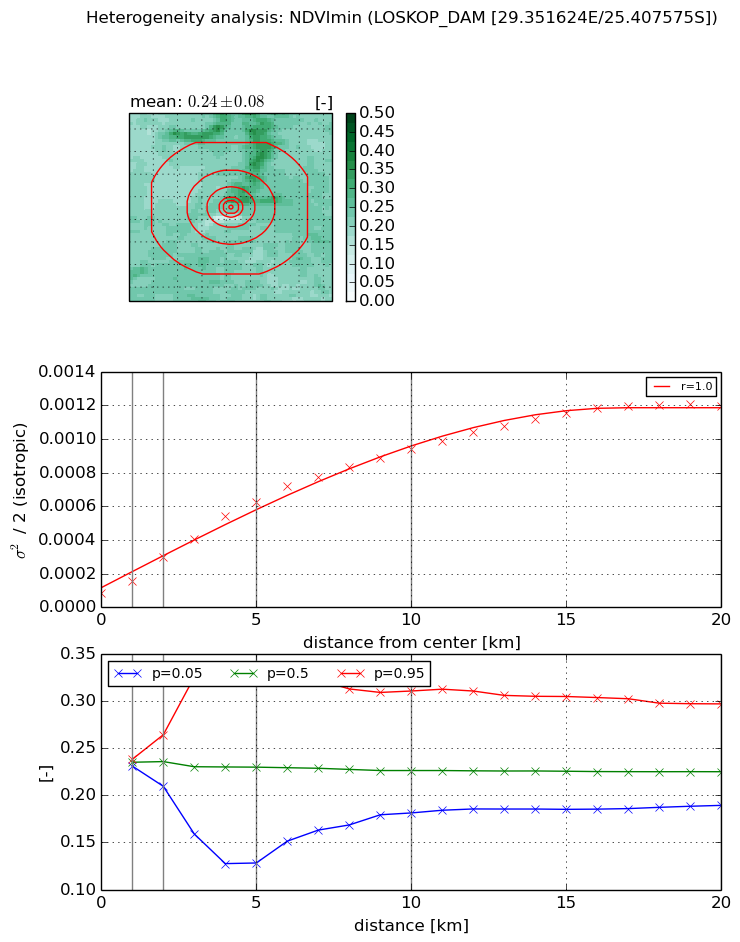
Heterogeneity analysis

The heterogeneity analysis provides information about the spatial and temporal heterogeneity of the site.

Topography


Roman et al. (2009) index


St

3.5572384491

Rcv

0.334685678172

Rse

0.0

Rst

-0.015221012199

Rsv

0.493444140034


Height range @ 1km [m]

223

Height range @ 2km [m]

223

Height range @ 5km [m]

284

Height range @ 10km [m]

-999

Height range @ 20km [m]

-999


Variance slope @ 1 km

3515

Variance slope @ 2 km

3551

Variance slope @ 5 km

2116

Variance slope @ 10 km

-999

Variance slope @ 20 km

-999


NDVI (max. NDVI composite)


Roman et al. (2009) index


St

9.1436098256

Rcv

0.237153691083

Rse

0.0

Rst

0.0045569359105

Rsv

-0.0863873624462


NDVI range @ 1km [-]

0.01

NDVI range @ 2km [-]

0.06

NDVI range @ 5km [-]

0.21

NDVI range @ 10km [-]

0.18

NDVI range @ 20km [-]

0.16


Variance slope @ 1 km

0.000198321315988

Variance slope @ 2 km

0.000267521565077

Variance slope @ 5 km

0.000266335451125

Variance slope @ 10 km

0.000226291151519

Variance slope @ 20 km

0.000123311489212


NDVI (min. NDVI composite)I


Roman et al. (2009) index


St

3.88912700917e-07

Rcv

0.141422769038

Rse

0.0

Rst

0.287094340275

Rsv

7713812.9618


NDVI range @ 1km [-]

0.01

NDVI range @ 2km [-]

0.05

NDVI range @ 5km [-]

0.2

NDVI range @ 10km [-]

0.13

NDVI range @ 20km [-]

0.11


NDVI slope @ 1 km

7.35963056305e-05

NDVI slope @ 2 km

0.000107893127801

NDVI slope @ 5 km

0.000112791911368

NDVI slope @ 10 km

8.83422593788e-05

NDVI slope @ 20 km

5.5647149067e-05


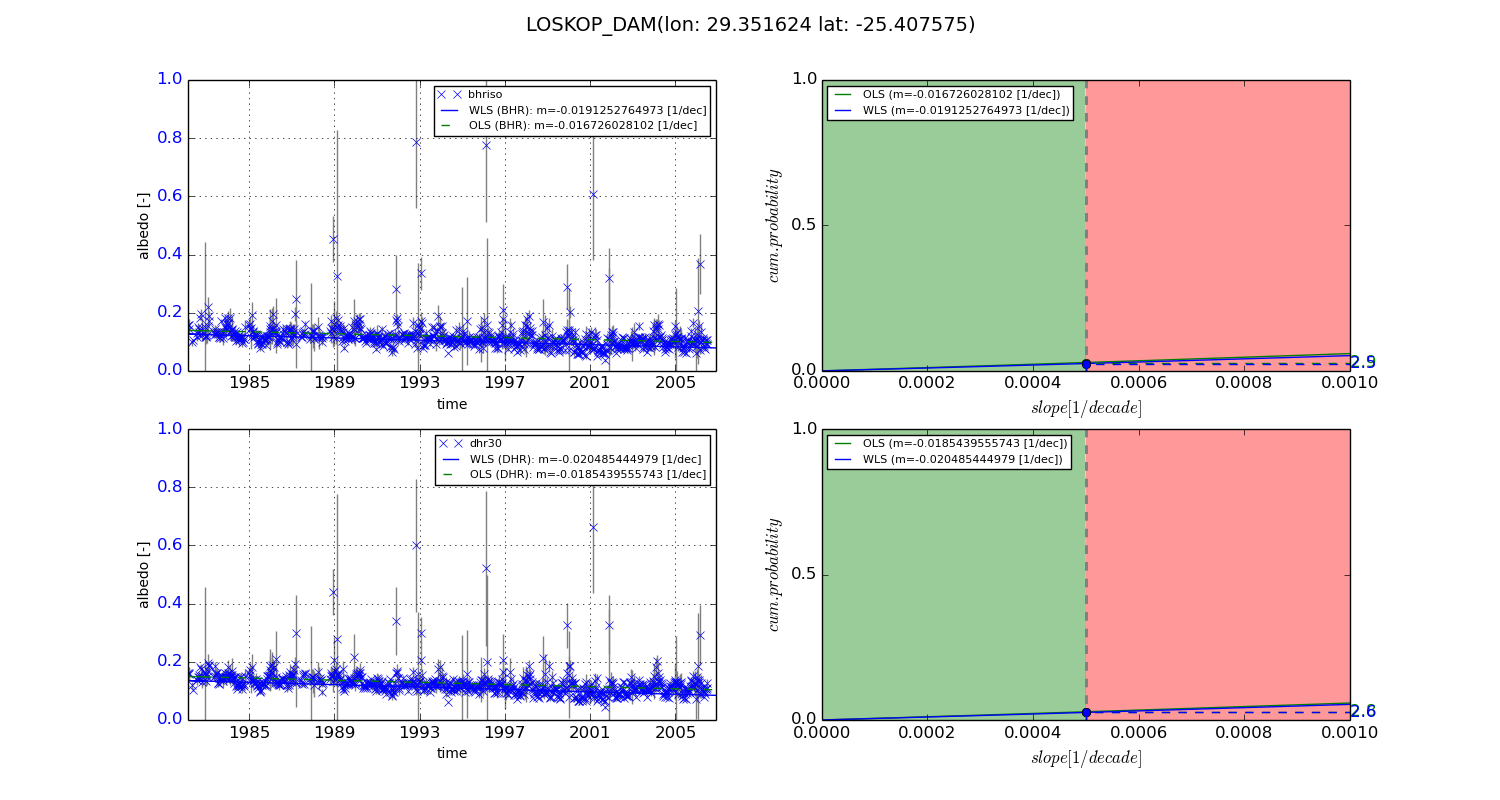
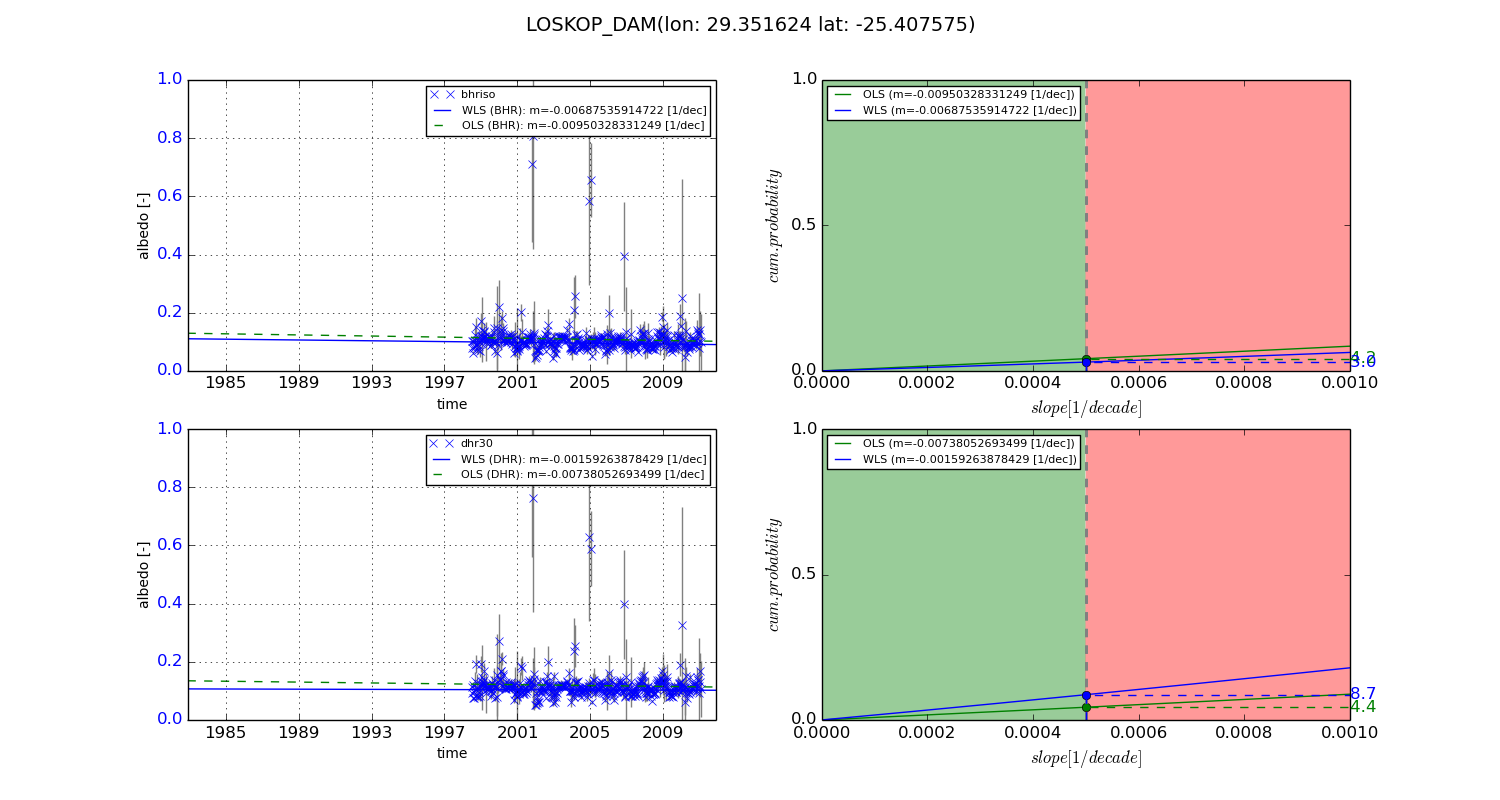
Temporal stability analysis

+000 deg (BHR)


BHR statistics

Temporal stability [1/decade]:


abs

rel


Weighted least square:

-0.0191252764973


Ordinary least square:

-0.016726028102


Probabilities that GCOS criteria is met:

Weighted least square:

2.5 %

Ordinary least square:

2.9 %


DHR statistics

Temporal stability [1/decade]:


abs

rel


Weighted least square:

-0.020485444979


Ordinary least square:

-0.0185439555743


Probabilities that GCOS criteria is met:

Weighted least square:

2.6 %

Ordinary least square:

2.8 %


+057/+063 deg (BHR)


BHR statistics

Temporal stability [1/decade]:


abs

rel


Weighted least square:

-0.00687535914722


Ordinary least square:

-0.00950328331249


Probabilities that GCOS criteria is met:

Weighted least square:

3.0 %

Ordinary least square:

4.2 %


DHR statistics

Temporal stability [1/decade]:


abs

rel


Weighted least square:

-0.00159263878429


Ordinary least square:

-0.00738052693499


Probabilities that GCOS criteria is met:

Weighted least square:

8.7 %

Ordinary least square:

4.4 %


Temporal anomaly analyis

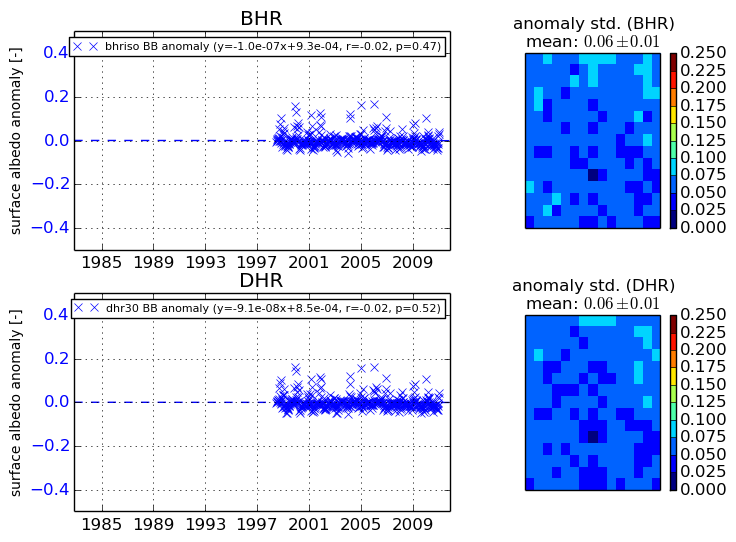
The variance of the temporal anomalies provides an additional measure about the stability of the signal AFTER removal of the mean seasonal cylce.
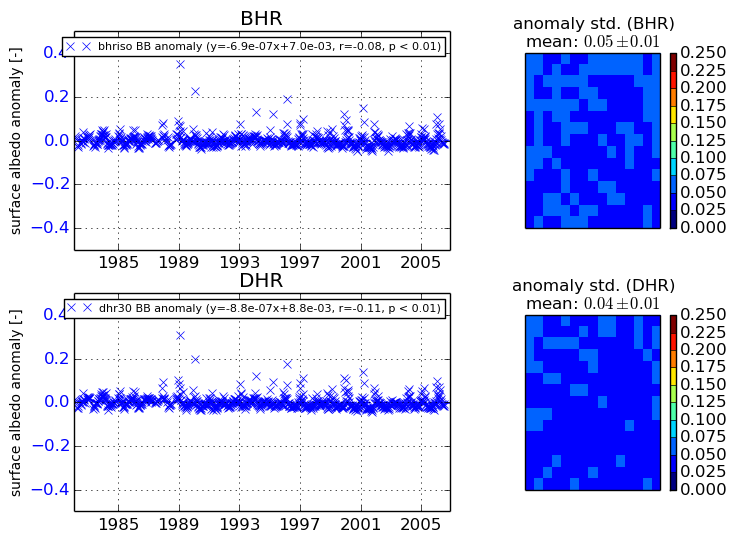
+000 deg


+057/+063 deg