LOS_ALAMOS


Location

lon / lat [deg]: -106.3261 / 35.8736

Source network: AERONET


Geostationary surface albedo (GSA) data


“+000”


“+057/+063”


Landcover information (based on ESA CCI landcover data)


Landcover fractions @ 2km distance


Landcover fractions @ 20 km distance


Legend


Distance to open water bodies [km]:

13.43

Distance to urban areas [km]:

0.03


Radius: 1 km

Number of landcover classes:

3

Dominant landcover type:

190: urban areas

Fraction of dominant landcover type [%]:

76.0


Radius: 2 km

Number of landcover classes:

4

Dominant landcover type:

190: urban areas

Fraction of dominant landcover type [%]:

48.0


Radius: 5 km

Number of landcover classes:

4

Dominant landcover type:

70: Tree cover, needleleaved, evergreen, closed to open (>15%)

Fraction of dominant landcover type [%]:

51.0


Radius: 10 km

Number of landcover classes:

4

Dominant landcover type:

70: Tree cover, needleleaved, evergreen, closed to open (>15%)

Fraction of dominant landcover type [%]:

60.0


Radius: 20 km

Number of landcover classes:

4

Dominant landcover type:

70: Tree cover, needleleaved, evergreen, closed to open (>15%)

Fraction of dominant landcover type [%]:

55.0


Disturbances


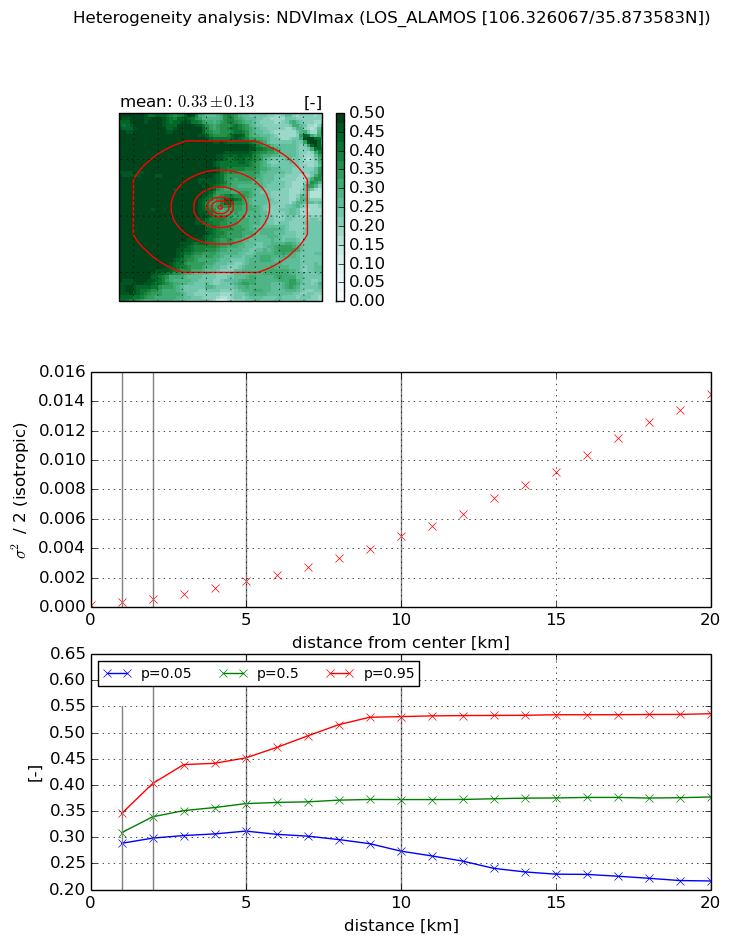
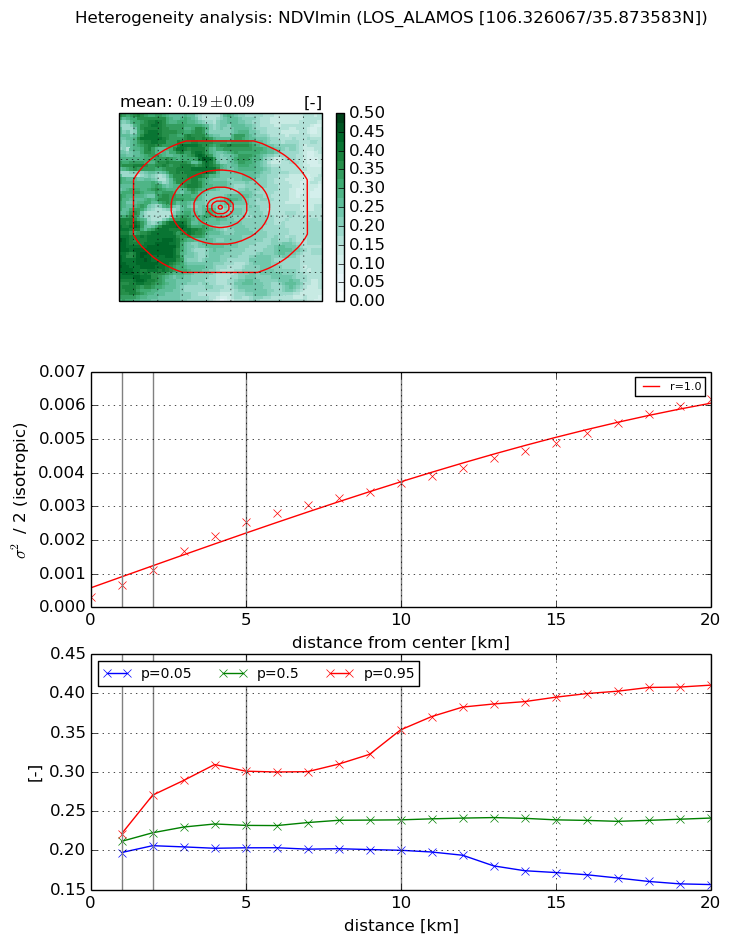
Heterogeneity analysis

The heterogeneity analysis provides information about the spatial and temporal heterogeneity of the site.

Topography


Roman et al. (2009) index


St

0.806719476401

Rcv

0.858772450328

Rse

0.0

Rst

2.49820450536e-07

Rsv

2.85999210938


Height range @ 1km [m]

87

Height range @ 2km [m]

163

Height range @ 5km [m]

498

Height range @ 10km [m]

-999

Height range @ 20km [m]

-999


Variance slope @ 1 km

3212

Variance slope @ 2 km

3713

Variance slope @ 5 km

5887

Variance slope @ 10 km

-999

Variance slope @ 20 km

-999


NDVI (max. NDVI composite)


Roman et al. (2009) index


St

2.11583717613

Rcv

0.0713837569487

Rse

0.0

Rst

-0.346495162484

Rsv

-0.999999560937


NDVI range @ 1km [-]

0.06

NDVI range @ 2km [-]

0.1

NDVI range @ 5km [-]

0.14

NDVI range @ 10km [-]

0.26

NDVI range @ 20km [-]

0.32


Variance slope @ 1 km

0.000182339551647

Variance slope @ 2 km

0.000203734026182

Variance slope @ 5 km

0.000322873273094

Variance slope @ 10 km

0.000462746904968

Variance slope @ 20 km

0.000740023884222


NDVI (min. NDVI composite)I


Roman et al. (2009) index


St

10.9880906848

Rcv

0.00149979950377

Rse

0.0

Rst

-0.10742810976

Rsv

0.164094955768


NDVI range @ 1km [-]

0.02

NDVI range @ 2km [-]

0.06

NDVI range @ 5km [-]

0.1

NDVI range @ 10km [-]

0.15

NDVI range @ 20km [-]

0.25


NDVI slope @ 1 km

0.000361036167861

NDVI slope @ 2 km

0.000400229016139

NDVI slope @ 5 km

0.000459922234476

NDVI slope @ 10 km

0.000345186883465

NDVI slope @ 20 km

0.000279327180452


Temporal stability analysis

+000 deg (BHR)


BHR statistics

Temporal stability [1/decade]:


abs

rel


Weighted least square:

None


Ordinary least square:

None


Probabilities that GCOS criteria is met:

Weighted least square:

None %

Ordinary least square:

None %


DHR statistics

Temporal stability [1/decade]:


abs

rel


Weighted least square:

None


Ordinary least square:

None


Probabilities that GCOS criteria is met:

Weighted least square:

None %

Ordinary least square:

None %


+057/+063 deg (BHR)


BHR statistics

Temporal stability [1/decade]:


abs

rel


Weighted least square:

None


Ordinary least square:

None


Probabilities that GCOS criteria is met:

Weighted least square:

None %

Ordinary least square:

None %


DHR statistics

Temporal stability [1/decade]:


abs

rel


Weighted least square:

None


Ordinary least square:

None


Probabilities that GCOS criteria is met:

Weighted least square:

None %

Ordinary least square:

None %


Temporal anomaly analyis

The variance of the temporal anomalies provides an additional measure about the stability of the signal AFTER removal of the mean seasonal cylce.

+000 deg


+057/+063 deg