LUGANSK


Location

lon / lat [deg]: 39.3647 / 48.5704

Source network: AERONET


Geostationary surface albedo (GSA) data


“+000”


“+057/+063”


Landcover information (based on ESA CCI landcover data)


Landcover fractions @ 2km distance


Landcover fractions @ 20 km distance


Legend


Distance to open water bodies [km]:

4.6

Distance to urban areas [km]:

0.06


Radius: 1 km

Number of landcover classes:

1

Dominant landcover type:

190: urban areas

Fraction of dominant landcover type [%]:

100.0


Radius: 2 km

Number of landcover classes:

1

Dominant landcover type:

190: urban areas

Fraction of dominant landcover type [%]:

100.0


Radius: 5 km

Number of landcover classes:

2

Dominant landcover type:

190: urban areas

Fraction of dominant landcover type [%]:

87.0


Radius: 10 km

Number of landcover classes:

6

Dominant landcover type:

10: cropland, rainfed

Fraction of dominant landcover type [%]:

46.0


Radius: 20 km

Number of landcover classes:

7

Dominant landcover type:

10: cropland, rainfed

Fraction of dominant landcover type [%]:

70.0


Disturbances


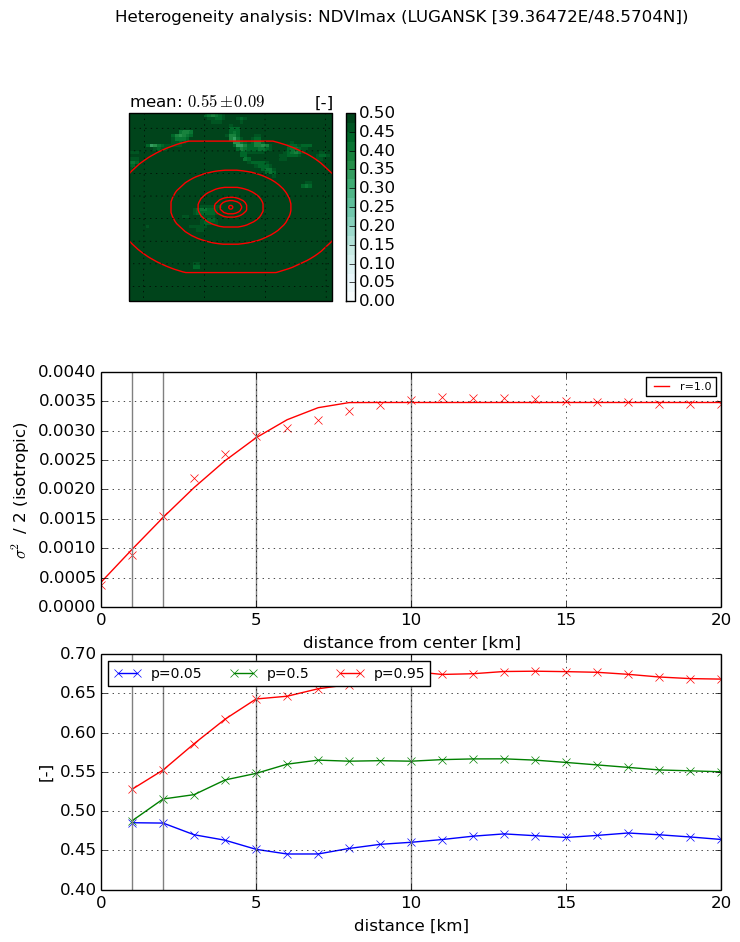
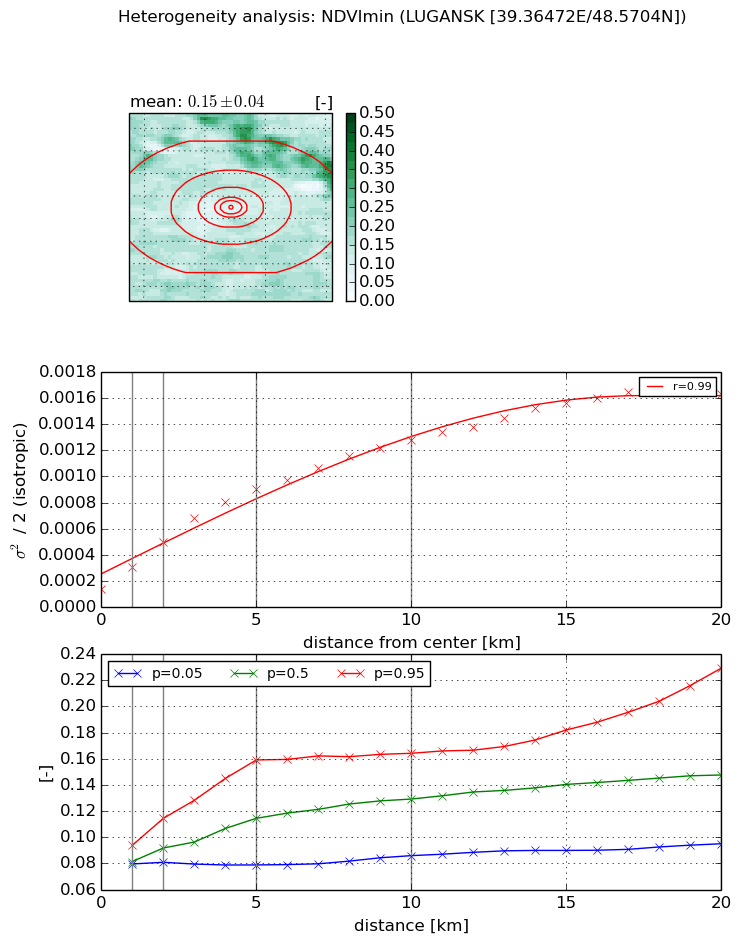
Heterogeneity analysis

The heterogeneity analysis provides information about the spatial and temporal heterogeneity of the site.

Topography


Roman et al. (2009) index


St

0.631159153782

Rcv

0.035103258239

Rse

0.0

Rst

1.3317688263e-06

Rsv

4.71805470749


Height range @ 1km [m]

55

Height range @ 2km [m]

94

Height range @ 5km [m]

136

Height range @ 10km [m]

-999

Height range @ 20km [m]

-999


Variance slope @ 1 km

233

Variance slope @ 2 km

328

Variance slope @ 5 km

427

Variance slope @ 10 km

-999

Variance slope @ 20 km

-999


NDVI (max. NDVI composite)


Roman et al. (2009) index


St

5.97149916239e-09

Rcv

0.49117444426

Rse

0.0

Rst

0.0703982344221

Rsv

502386404.999


NDVI range @ 1km [-]

0.04

NDVI range @ 2km [-]

0.07

NDVI range @ 5km [-]

0.19

NDVI range @ 10km [-]

0.22

NDVI range @ 20km [-]

0.2


Variance slope @ 1 km

0.000510253008056

Variance slope @ 2 km

0.000583008612316

Variance slope @ 5 km

0.0005258903256

Variance slope @ 10 km

0.000305384132661

Variance slope @ 20 km

0.000117155154751


NDVI (min. NDVI composite)I


Roman et al. (2009) index


St

3.21094708208

Rcv

0.38020586831

Rse

0.0

Rst

-0.0652205705339

Rsv

0.488877342351


NDVI range @ 1km [-]

0.01

NDVI range @ 2km [-]

0.03

NDVI range @ 5km [-]

0.08

NDVI range @ 10km [-]

0.08

NDVI range @ 20km [-]

0.13


NDVI slope @ 1 km

0.000160797072257

NDVI slope @ 2 km

0.00017859509476

NDVI slope @ 5 km

0.000156829887572

NDVI slope @ 10 km

0.000111484589998

NDVI slope @ 20 km

7.11391777024e-05


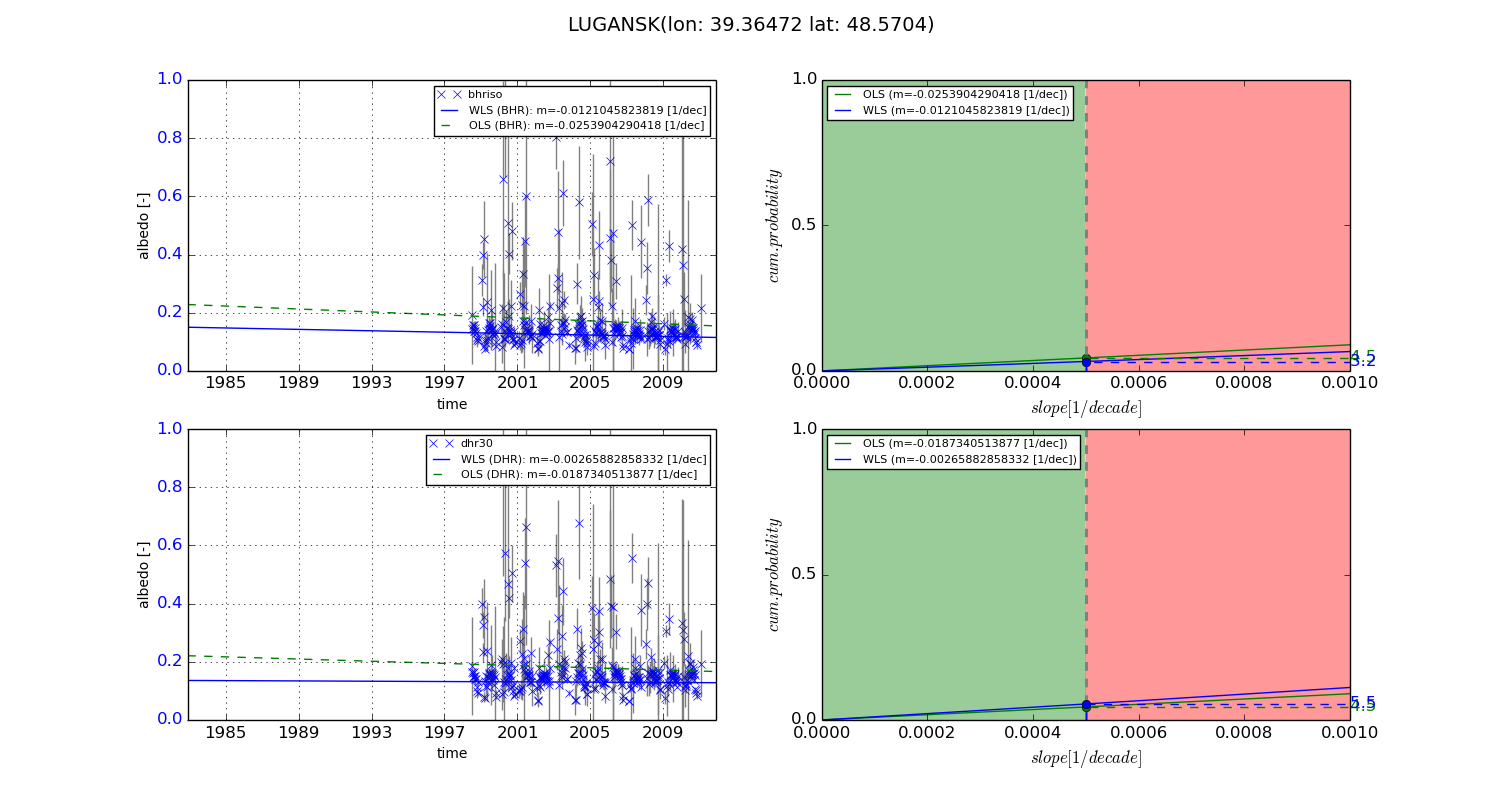
Temporal stability analysis

+000 deg (BHR)


BHR statistics

Temporal stability [1/decade]:


abs

rel


Weighted least square:

-99999.0


Ordinary least square:

-99999.0


Probabilities that GCOS criteria is met:

Weighted least square:

-99999.0 %

Ordinary least square:

-99999.0 %


DHR statistics

Temporal stability [1/decade]:


abs

rel


Weighted least square:

-99999.0


Ordinary least square:

-99999.0


Probabilities that GCOS criteria is met:

Weighted least square:

-99999.0 %

Ordinary least square:

-99999.0 %


+057/+063 deg (BHR)


BHR statistics

Temporal stability [1/decade]:


abs

rel


Weighted least square:

-0.0121045823819


Ordinary least square:

-0.0253904290418


Probabilities that GCOS criteria is met:

Weighted least square:

3.2 %

Ordinary least square:

4.5 %


DHR statistics

Temporal stability [1/decade]:


abs

rel


Weighted least square:

-0.00265882858332


Ordinary least square:

-0.0187340513877


Probabilities that GCOS criteria is met:

Weighted least square:

5.5 %

Ordinary least square:

4.5 %


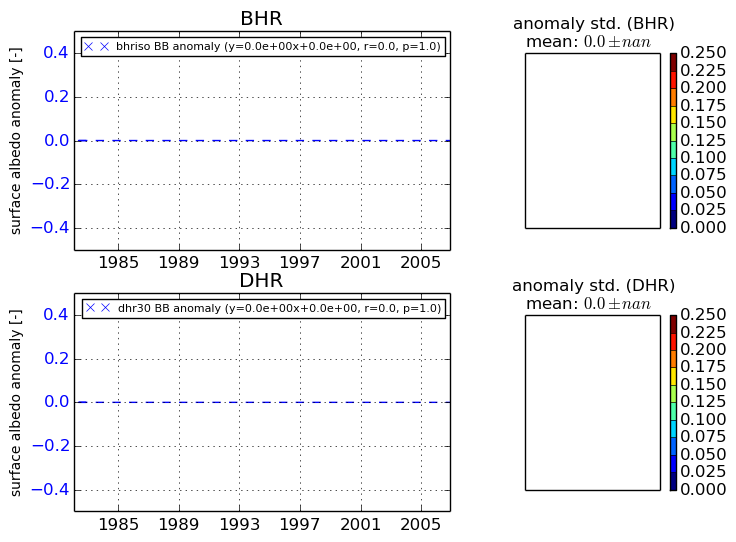
Temporal anomaly analyis

The variance of the temporal anomalies provides an additional measure about the stability of the signal AFTER removal of the mean seasonal cylce.
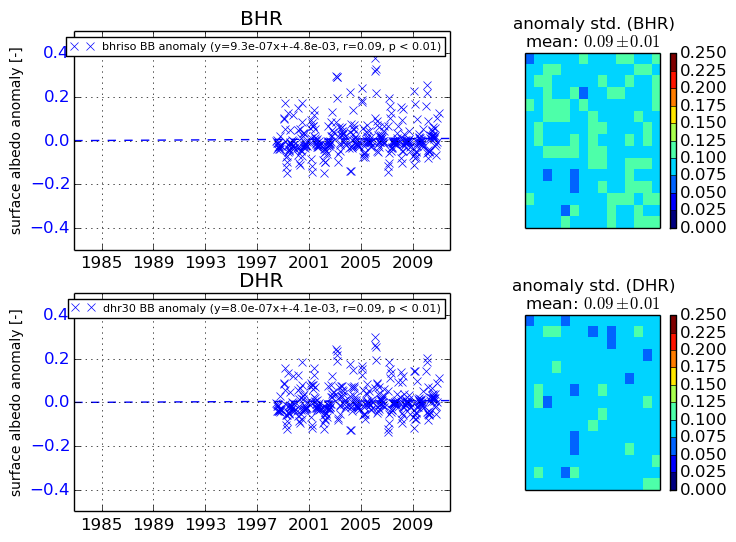
+000 deg


+057/+063 deg