LULIN


Location

lon / lat [deg]: 120.8736 / 23.4686

Source network: AERONET


Geostationary surface albedo (GSA) data


“+000”


“+057/+063”


Landcover information (based on ESA CCI landcover data)


Landcover fractions @ 2km distance


Landcover fractions @ 20 km distance


Legend


Distance to open water bodies [km]:

4.36

Distance to urban areas [km]:

31.61


Radius: 1 km

Number of landcover classes:

1

Dominant landcover type:

50: Tree cover, broadleaved, evergreen, closed to open (>15%)

Fraction of dominant landcover type [%]:

100.0


Radius: 2 km

Number of landcover classes:

2

Dominant landcover type:

50: Tree cover, broadleaved, evergreen, closed to open (>15%)

Fraction of dominant landcover type [%]:

99.0


Radius: 5 km

Number of landcover classes:

1

Dominant landcover type:

50: Tree cover, broadleaved, evergreen, closed to open (>15%)

Fraction of dominant landcover type [%]:

99.0


Radius: 10 km

Number of landcover classes:

1

Dominant landcover type:

50: Tree cover, broadleaved, evergreen, closed to open (>15%)

Fraction of dominant landcover type [%]:

99.0


Radius: 20 km

Number of landcover classes:

1

Dominant landcover type:

50: Tree cover, broadleaved, evergreen, closed to open (>15%)

Fraction of dominant landcover type [%]:

98.0


Disturbances


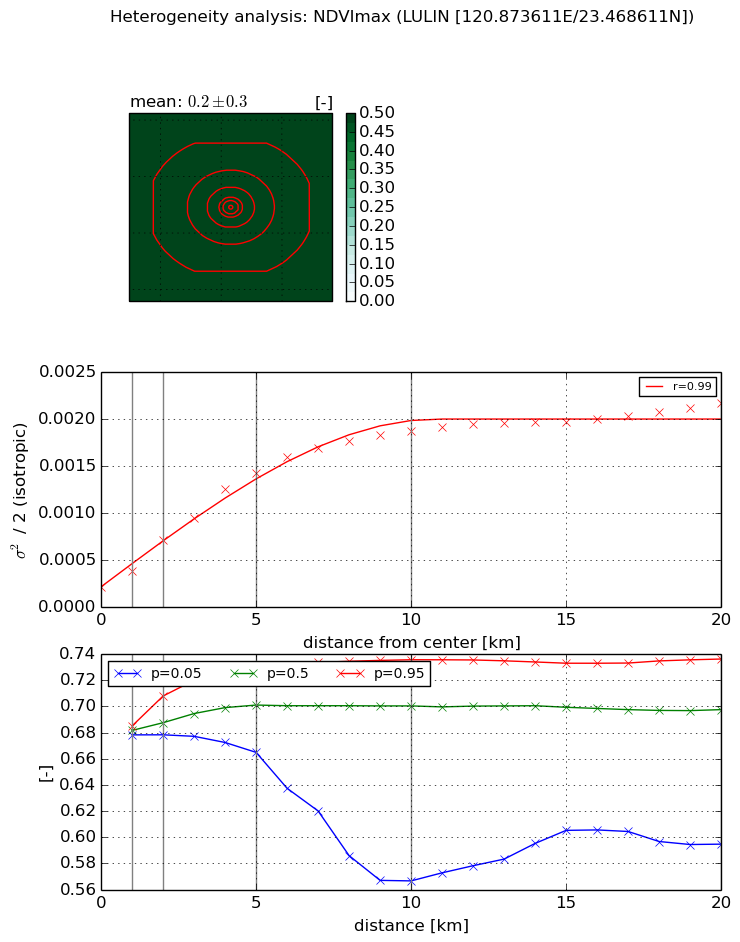
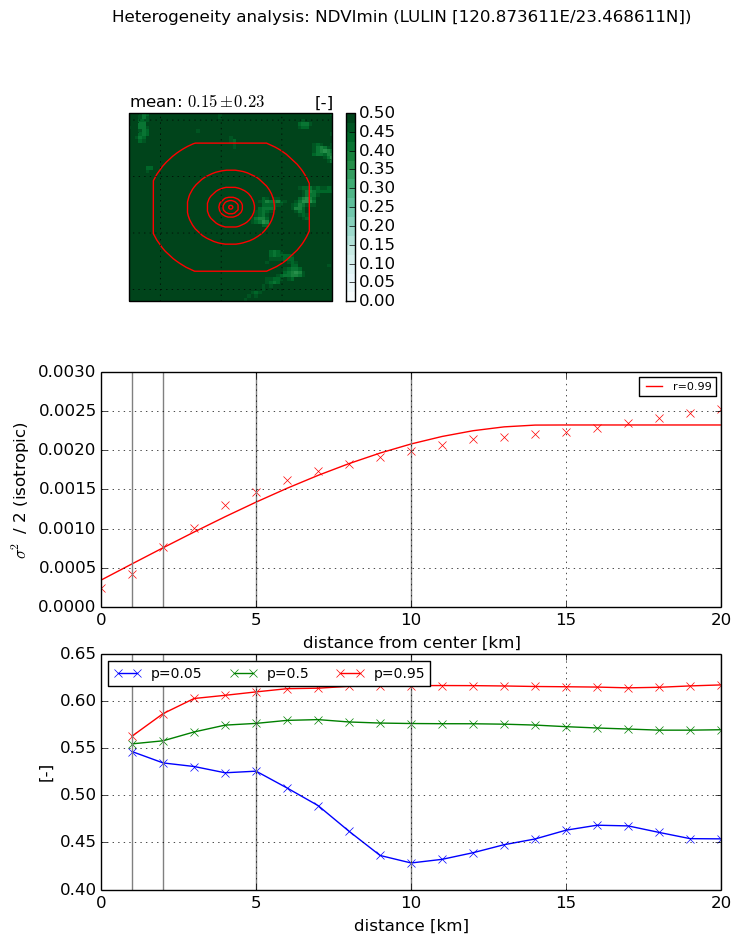
Heterogeneity analysis

The heterogeneity analysis provides information about the spatial and temporal heterogeneity of the site.

Topography


Roman et al. (2009) index


St

2.29714779192

Rcv

0.41943653644

Rse

0.0

Rst

-0.0703891811908

Rsv

0.816141626111


Height range @ 1km [m]

349

Height range @ 2km [m]

635

Height range @ 5km [m]

1154

Height range @ 10km [m]

-999

Height range @ 20km [m]

-999


Variance slope @ 1 km

44326

Variance slope @ 2 km

48612

Variance slope @ 5 km

34884

Variance slope @ 10 km

-999

Variance slope @ 20 km

-999


NDVI (max. NDVI composite)


Roman et al. (2009) index


St

1.56027325552

Rcv

0.432504242012

Rse

0.0

Rst

-0.490235891646

Rsv

-0.999999994967


NDVI range @ 1km [-]

0.01

NDVI range @ 2km [-]

0.03

NDVI range @ 5km [-]

0.06

NDVI range @ 10km [-]

0.17

NDVI range @ 20km [-]

0.14


Variance slope @ 1 km

0.000171272835844

Variance slope @ 2 km

0.000249758787275

Variance slope @ 5 km

0.000254973483115

Variance slope @ 10 km

0.000173477184776

Variance slope @ 20 km

8.26723426938e-05


NDVI (min. NDVI composite)I


Roman et al. (2009) index


St

2.68759601799

Rcv

0.138300876595

Rse

0.0

Rst

-0.205872190635

Rsv

0.772066121964


NDVI range @ 1km [-]

0.02

NDVI range @ 2km [-]

0.05

NDVI range @ 5km [-]

0.08

NDVI range @ 10km [-]

0.19

NDVI range @ 20km [-]

0.16


NDVI slope @ 1 km

0.000182027763331

NDVI slope @ 2 km

0.000261052530475

NDVI slope @ 5 km

0.000257496829647

NDVI slope @ 10 km

0.000178884469261

NDVI slope @ 20 km

0.000101275844258


Temporal stability analysis

+000 deg (BHR)


BHR statistics

Temporal stability [1/decade]:


abs

rel


Weighted least square:

None


Ordinary least square:

None


Probabilities that GCOS criteria is met:

Weighted least square:

None %

Ordinary least square:

None %


DHR statistics

Temporal stability [1/decade]:


abs

rel


Weighted least square:

None


Ordinary least square:

None


Probabilities that GCOS criteria is met:

Weighted least square:

None %

Ordinary least square:

None %


+057/+063 deg (BHR)


BHR statistics

Temporal stability [1/decade]:


abs

rel


Weighted least square:

-99999.0


Ordinary least square:

-99999.0


Probabilities that GCOS criteria is met:

Weighted least square:

-99999.0 %

Ordinary least square:

-99999.0 %


DHR statistics

Temporal stability [1/decade]:


abs

rel


Weighted least square:

-99999.0


Ordinary least square:

-99999.0


Probabilities that GCOS criteria is met:

Weighted least square:

-99999.0 %

Ordinary least square:

-99999.0 %


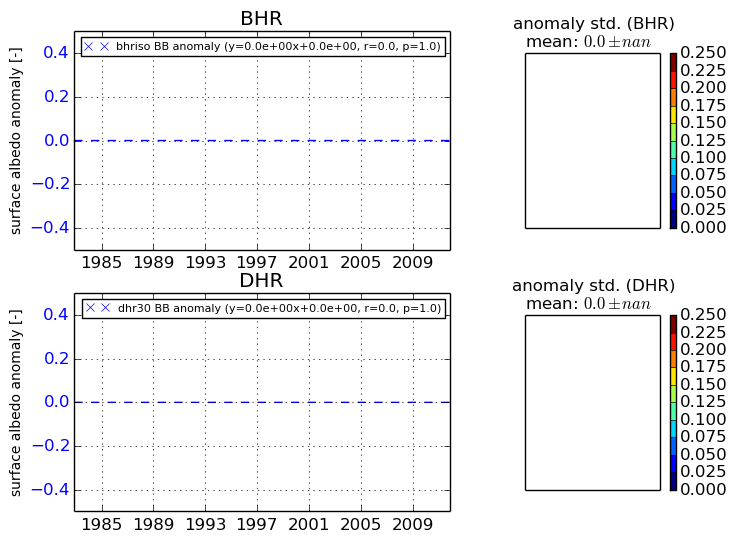
Temporal anomaly analyis

The variance of the temporal anomalies provides an additional measure about the stability of the signal AFTER removal of the mean seasonal cylce.

+000 deg


+057/+063 deg