LUQUILLO_LTER_LUQ


Location

lon / lat [deg]: -65.8 / 18.3

Source network: LTER


Geostationary surface albedo (GSA) data


“+000”


“+057/+063”


Landcover information (based on ESA CCI landcover data)


Landcover fractions @ 2km distance


Landcover fractions @ 20 km distance


Legend


Distance to open water bodies [km]:

10.25

Distance to urban areas [km]:

7.39


Radius: 1 km

Number of landcover classes:

1

Dominant landcover type:

50: Tree cover, broadleaved, evergreen, closed to open (>15%)

Fraction of dominant landcover type [%]:

100.0


Radius: 2 km

Number of landcover classes:

3

Dominant landcover type:

50: Tree cover, broadleaved, evergreen, closed to open (>15%)

Fraction of dominant landcover type [%]:

93.0


Radius: 5 km

Number of landcover classes:

4

Dominant landcover type:

50: Tree cover, broadleaved, evergreen, closed to open (>15%)

Fraction of dominant landcover type [%]:

94.0


Radius: 10 km

Number of landcover classes:

5

Dominant landcover type:

50: Tree cover, broadleaved, evergreen, closed to open (>15%)

Fraction of dominant landcover type [%]:

75.0


Radius: 20 km

Number of landcover classes:

7

Dominant landcover type:

50: Tree cover, broadleaved, evergreen, closed to open (>15%)

Fraction of dominant landcover type [%]:

32.0


Disturbances


Heterogeneity analysis

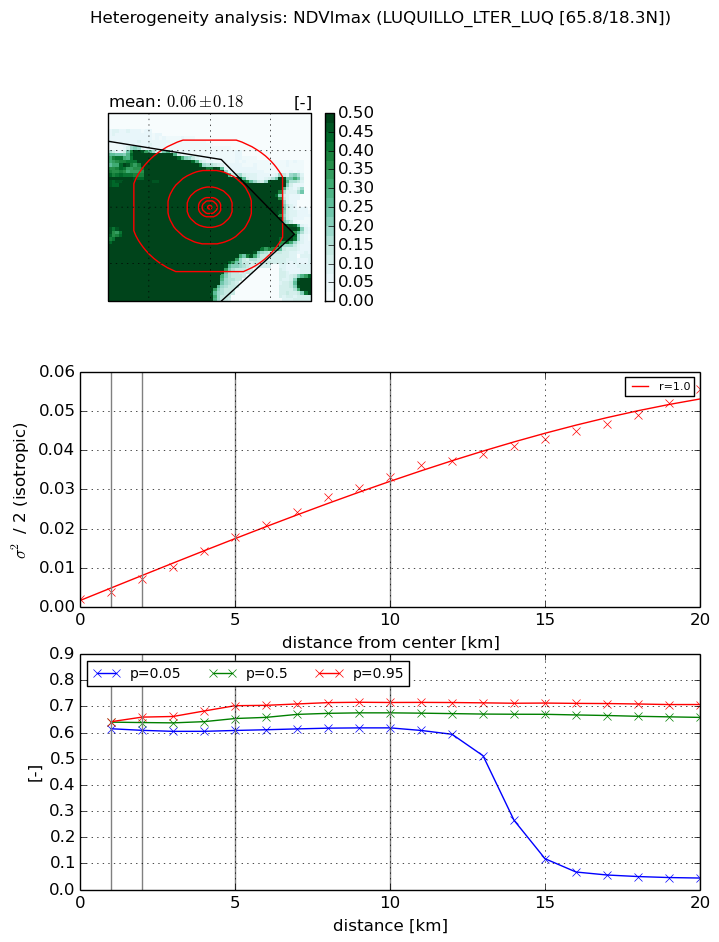
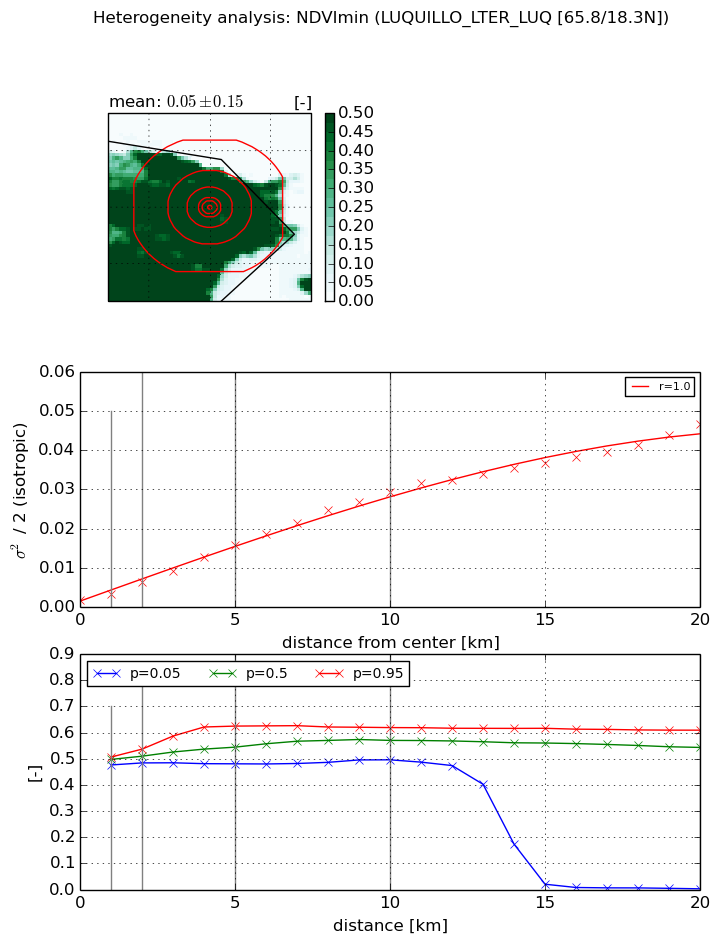
The heterogeneity analysis provides information about the spatial and temporal heterogeneity of the site.

Topography


Roman et al. (2009) index


St

1.45052149502

Rcv

1.1478165522

Rse

0.0

Rst

-0.00853919037955

Rsv

0.911865935138


Height range @ 1km [m]

201

Height range @ 2km [m]

289

Height range @ 5km [m]

677

Height range @ 10km [m]

-999

Height range @ 20km [m]

-999


Variance slope @ 1 km

9925

Variance slope @ 2 km

12845

Variance slope @ 5 km

13627

Variance slope @ 10 km

-999

Variance slope @ 20 km

-999


NDVI (max. NDVI composite)


Roman et al. (2009) index


St

3.58380706283

Rcv

0.405024722577

Rse

0.0

Rst

-0.152361088046

Rsv

0.279712824265


NDVI range @ 1km [-]

0.03

NDVI range @ 2km [-]

0.05

NDVI range @ 5km [-]

0.09

NDVI range @ 10km [-]

0.1

NDVI range @ 20km [-]

0.66


Variance slope @ 1 km

0.00184669660975

Variance slope @ 2 km

0.00262181637356

Variance slope @ 5 km

0.00324193762218

Variance slope @ 10 km

0.00326979040201

Variance slope @ 20 km

0.00262324613829


NDVI (min. NDVI composite)I


Roman et al. (2009) index


St

2.59458456893

Rcv

0.454439978812

Rse

0.0

Rst

-0.0190555491299

Rsv

0.682758939892


NDVI range @ 1km [-]

0.03

NDVI range @ 2km [-]

0.05

NDVI range @ 5km [-]

0.14

NDVI range @ 10km [-]

0.12

NDVI range @ 20km [-]

0.61


NDVI slope @ 1 km

0.00163910755195

NDVI slope @ 2 km

0.00233771208713

NDVI slope @ 5 km

0.00290027871859

NDVI slope @ 10 km

0.00287965280746

NDVI slope @ 20 km

0.00219309066273


Temporal stability analysis

+000 deg (BHR)


BHR statistics

Temporal stability [1/decade]:


abs

rel


Weighted least square:

-99999.0


Ordinary least square:

-99999.0


Probabilities that GCOS criteria is met:

Weighted least square:

-99999.0 %

Ordinary least square:

-99999.0 %


DHR statistics

Temporal stability [1/decade]:


abs

rel


Weighted least square:

-99999.0


Ordinary least square:

-99999.0


Probabilities that GCOS criteria is met:

Weighted least square:

-99999.0 %

Ordinary least square:

-99999.0 %


+057/+063 deg (BHR)


BHR statistics

Temporal stability [1/decade]:


abs

rel


Weighted least square:

None


Ordinary least square:

None


Probabilities that GCOS criteria is met:

Weighted least square:

None %

Ordinary least square:

None %


DHR statistics

Temporal stability [1/decade]:


abs

rel


Weighted least square:

None


Ordinary least square:

None


Probabilities that GCOS criteria is met:

Weighted least square:

None %

Ordinary least square:

None %


Temporal anomaly analyis

The variance of the temporal anomalies provides an additional measure about the stability of the signal AFTER removal of the mean seasonal cylce.

+000 deg


+057/+063 deg