LUT_DESERT_00002


Location

lon / lat [deg]: 58.952 / 30.242

Source network: ALBEDOVAL2


Geostationary surface albedo (GSA) data


“+000”


“+057/+063”


Landcover information (based on ESA CCI landcover data)


Landcover fractions @ 2km distance


Landcover fractions @ 20 km distance


Legend


Distance to open water bodies [km]:

none in region

Distance to urban areas [km]:

none in region


Radius: 1 km

Number of landcover classes:

1

Dominant landcover type:

200: bare areas

Fraction of dominant landcover type [%]:

100.0


Radius: 2 km

Number of landcover classes:

1

Dominant landcover type:

200: bare areas

Fraction of dominant landcover type [%]:

100.0


Radius: 5 km

Number of landcover classes:

1

Dominant landcover type:

200: bare areas

Fraction of dominant landcover type [%]:

100.0


Radius: 10 km

Number of landcover classes:

1

Dominant landcover type:

200: bare areas

Fraction of dominant landcover type [%]:

100.0


Radius: 20 km

Number of landcover classes:

1

Dominant landcover type:

200: bare areas

Fraction of dominant landcover type [%]:

100.0


Disturbances


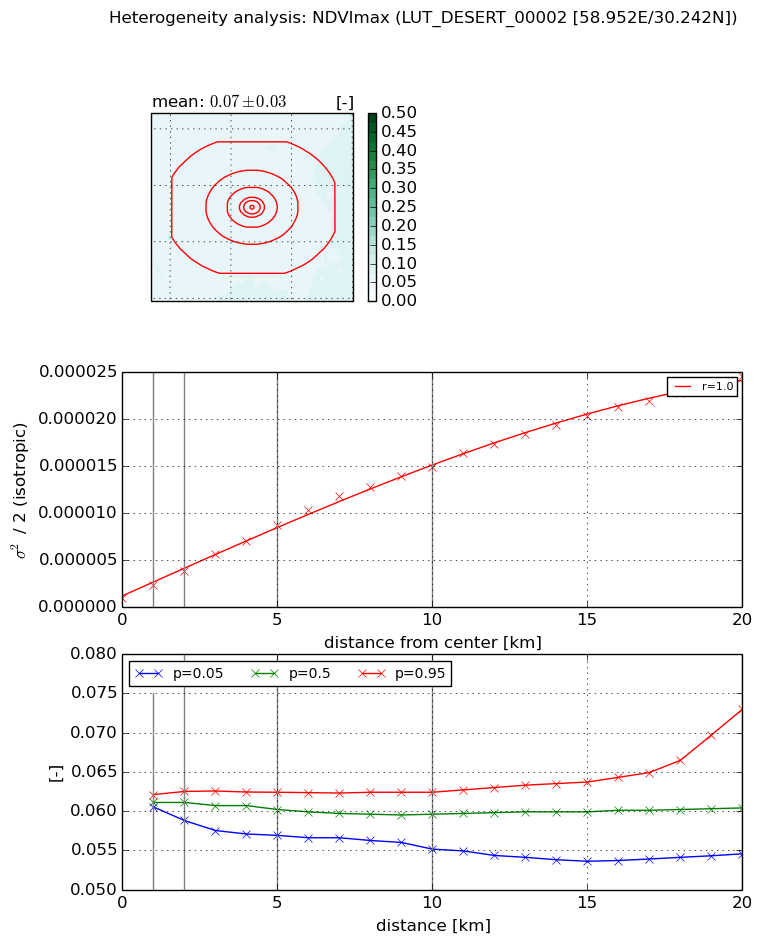
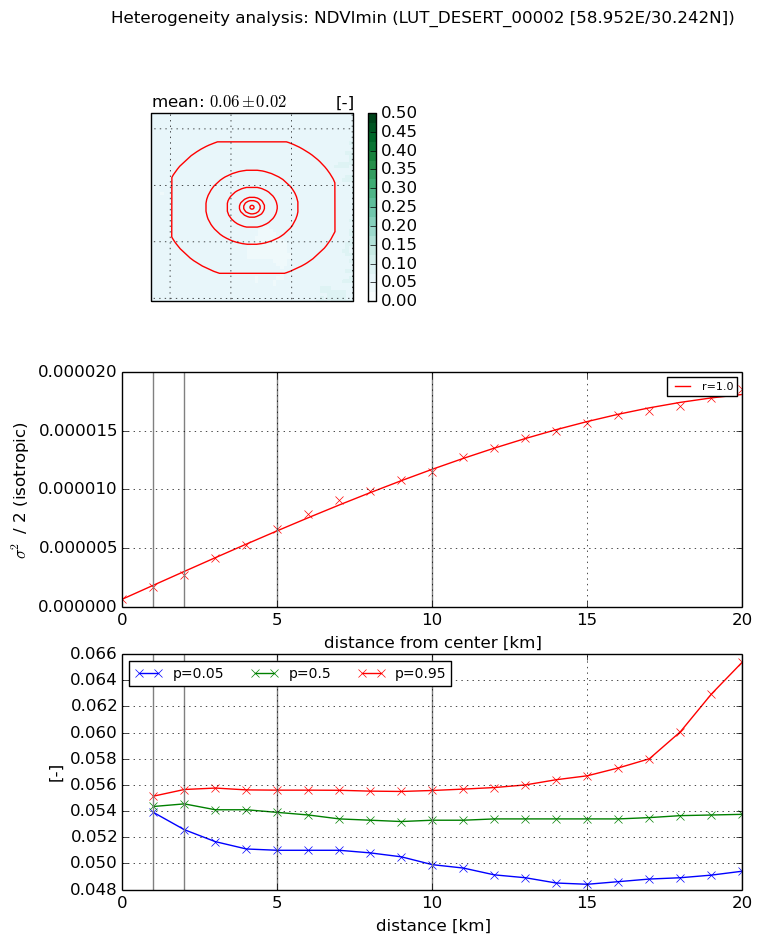
Heterogeneity analysis

The heterogeneity analysis provides information about the spatial and temporal heterogeneity of the site.

Topography


Roman et al. (2009) index


St

4.95894949437

Rcv

0.447340888802

Rse

0.0

Rst

-6.78315434764e-06

Rsv

-0.157619166969


Height range @ 1km [m]

6

Height range @ 2km [m]

25

Height range @ 5km [m]

59

Height range @ 10km [m]

-999

Height range @ 20km [m]

-999


Variance slope @ 1 km

34

Variance slope @ 2 km

41

Variance slope @ 5 km

53

Variance slope @ 10 km

-999

Variance slope @ 20 km

-999


NDVI (max. NDVI composite)


Roman et al. (2009) index


St

2.22313766896

Rcv

0.16520900934

Rse

0.0

Rst

-0.184235760987

Rsv

-0.999999324788


NDVI range @ 1km [-]

0.0

NDVI range @ 2km [-]

0.0

NDVI range @ 5km [-]

0.01

NDVI range @ 10km [-]

0.01

NDVI range @ 20km [-]

0.02


Variance slope @ 1 km

1.38178582469e-06

Variance slope @ 2 km

1.40015081306e-06

Variance slope @ 5 km

1.5584225803e-06

Variance slope @ 10 km

1.43397107383e-06

Variance slope @ 20 km

1.17281631966e-06


NDVI (min. NDVI composite)I


Roman et al. (2009) index


St

2.16515851852

Rcv

0.174152237616

Rse

0.0

Rst

-0.211427874524

Rsv

-0.999999730787


NDVI range @ 1km [-]

0.0

NDVI range @ 2km [-]

0.0

NDVI range @ 5km [-]

0.0

NDVI range @ 10km [-]

0.01

NDVI range @ 20km [-]

0.02


NDVI slope @ 1 km

1.00978684801e-06

NDVI slope @ 2 km

1.02080358287e-06

NDVI slope @ 5 km

1.18729861522e-06

NDVI slope @ 10 km

1.13064596006e-06

NDVI slope @ 20 km

8.96573270483e-07


Temporal stability analysis

+000 deg (BHR)


BHR statistics

Temporal stability [1/decade]:


abs

rel


Weighted least square:

-99999.0


Ordinary least square:

-99999.0


Probabilities that GCOS criteria is met:

Weighted least square:

-99999.0 %

Ordinary least square:

-99999.0 %


DHR statistics

Temporal stability [1/decade]:


abs

rel


Weighted least square:

-99999.0


Ordinary least square:

-99999.0


Probabilities that GCOS criteria is met:

Weighted least square:

-99999.0 %

Ordinary least square:

-99999.0 %


+057/+063 deg (BHR)


BHR statistics

Temporal stability [1/decade]:


abs

rel


Weighted least square:

-0.0141055789506


Ordinary least square:

-0.0180780431119


Probabilities that GCOS criteria is met:

Weighted least square:

2.7 %

Ordinary least square:

2.9 %


DHR statistics

Temporal stability [1/decade]:


abs

rel


Weighted least square:

-0.00729409736352


Ordinary least square:

-0.0134011157053


Probabilities that GCOS criteria is met:

Weighted least square:

3.1 %

Ordinary least square:

2.9 %


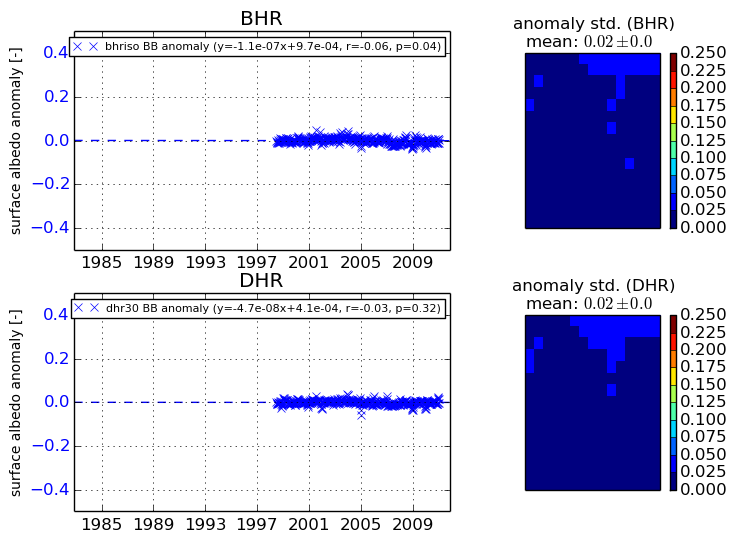
Temporal anomaly analyis

The variance of the temporal anomalies provides an additional measure about the stability of the signal AFTER removal of the mean seasonal cylce.
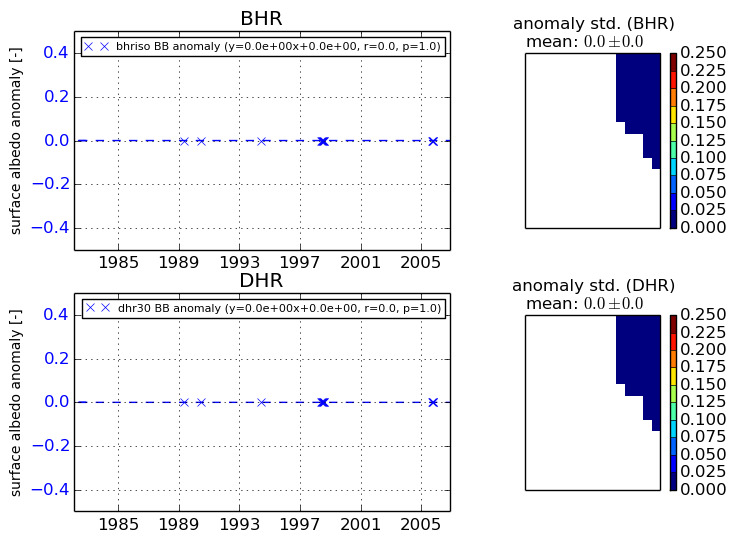
+000 deg


+057/+063 deg