LYDENBURG


Location

lon / lat [deg]: 30.7667 / -24.5667

Source network: AERONET


Geostationary surface albedo (GSA) data


“+000”


“+057/+063”


Landcover information (based on ESA CCI landcover data)


Landcover fractions @ 2km distance


Landcover fractions @ 20 km distance


Legend


Distance to open water bodies [km]:

2.99

Distance to urban areas [km]:

21.51


Radius: 1 km

Number of landcover classes:

3

Dominant landcover type:

130: grassland

Fraction of dominant landcover type [%]:

61.0


Radius: 2 km

Number of landcover classes:

5

Dominant landcover type:

62: Tree cover, broadleaved, decidous (open 15-40%)

Fraction of dominant landcover type [%]:

58.0


Radius: 5 km

Number of landcover classes:

7

Dominant landcover type:

62: Tree cover, broadleaved, decidous (open 15-40%)

Fraction of dominant landcover type [%]:

49.0


Radius: 10 km

Number of landcover classes:

9

Dominant landcover type:

62: Tree cover, broadleaved, decidous (open 15-40%)

Fraction of dominant landcover type [%]:

45.0


Radius: 20 km

Number of landcover classes:

10

Dominant landcover type:

62: Tree cover, broadleaved, decidous (open 15-40%)

Fraction of dominant landcover type [%]:

43.0


Disturbances


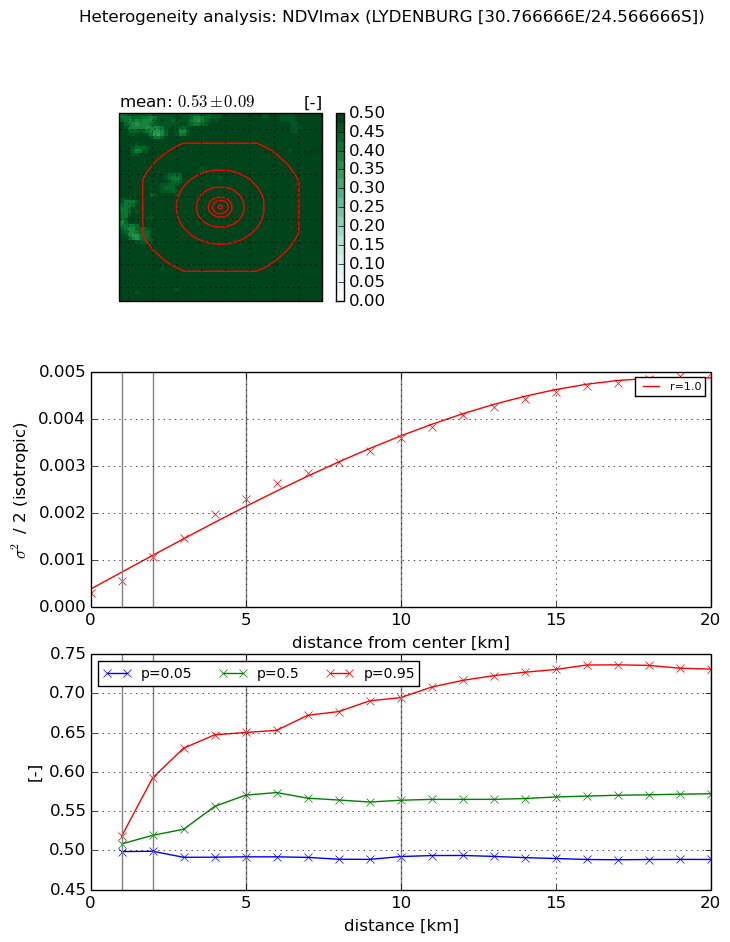
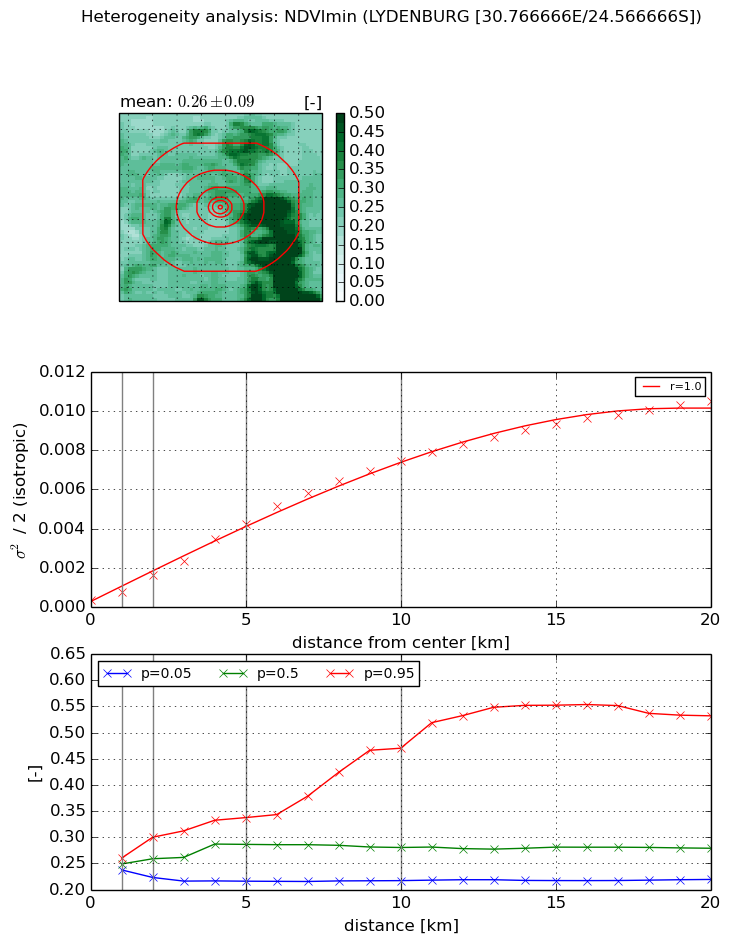
Heterogeneity analysis

The heterogeneity analysis provides information about the spatial and temporal heterogeneity of the site.

Topography


Roman et al. (2009) index


St

4.28507425524e-05

Rcv

0.903454697515

Rse

0.0

Rst

-0.0164547886418

Rsv

70009.5354829


Height range @ 1km [m]

106

Height range @ 2km [m]

175

Height range @ 5km [m]

600

Height range @ 10km [m]

-999

Height range @ 20km [m]

-999


Variance slope @ 1 km

12436

Variance slope @ 2 km

10687

Variance slope @ 5 km

6659

Variance slope @ 10 km

-999

Variance slope @ 20 km

-999


NDVI (max. NDVI composite)


Roman et al. (2009) index


St

5.1501124126e-07

Rcv

0.126054590414

Rse

0.0

Rst

0.313101724613

Rsv

5825115.13048


NDVI range @ 1km [-]

0.02

NDVI range @ 2km [-]

0.09

NDVI range @ 5km [-]

0.16

NDVI range @ 10km [-]

0.2

NDVI range @ 20km [-]

0.24


Variance slope @ 1 km

0.00026254199919

Variance slope @ 2 km

0.000381770059888

Variance slope @ 5 km

0.000416607938602

Variance slope @ 10 km

0.000336439462907

Variance slope @ 20 km

0.000235105055557


NDVI (min. NDVI composite)I


Roman et al. (2009) index


St

3.08117337538

Rcv

0.146275312537

Rse

0.0

Rst

0.0295212870297

Rsv

0.79785844496


NDVI range @ 1km [-]

0.02

NDVI range @ 2km [-]

0.08

NDVI range @ 5km [-]

0.12

NDVI range @ 10km [-]

0.25

NDVI range @ 20km [-]

0.31


NDVI slope @ 1 km

0.000388350127888

NDVI slope @ 2 km

0.000618374068794

NDVI slope @ 5 km

0.000802067032502

NDVI slope @ 10 km

0.000754959204629

NDVI slope @ 20 km

0.00051682396913


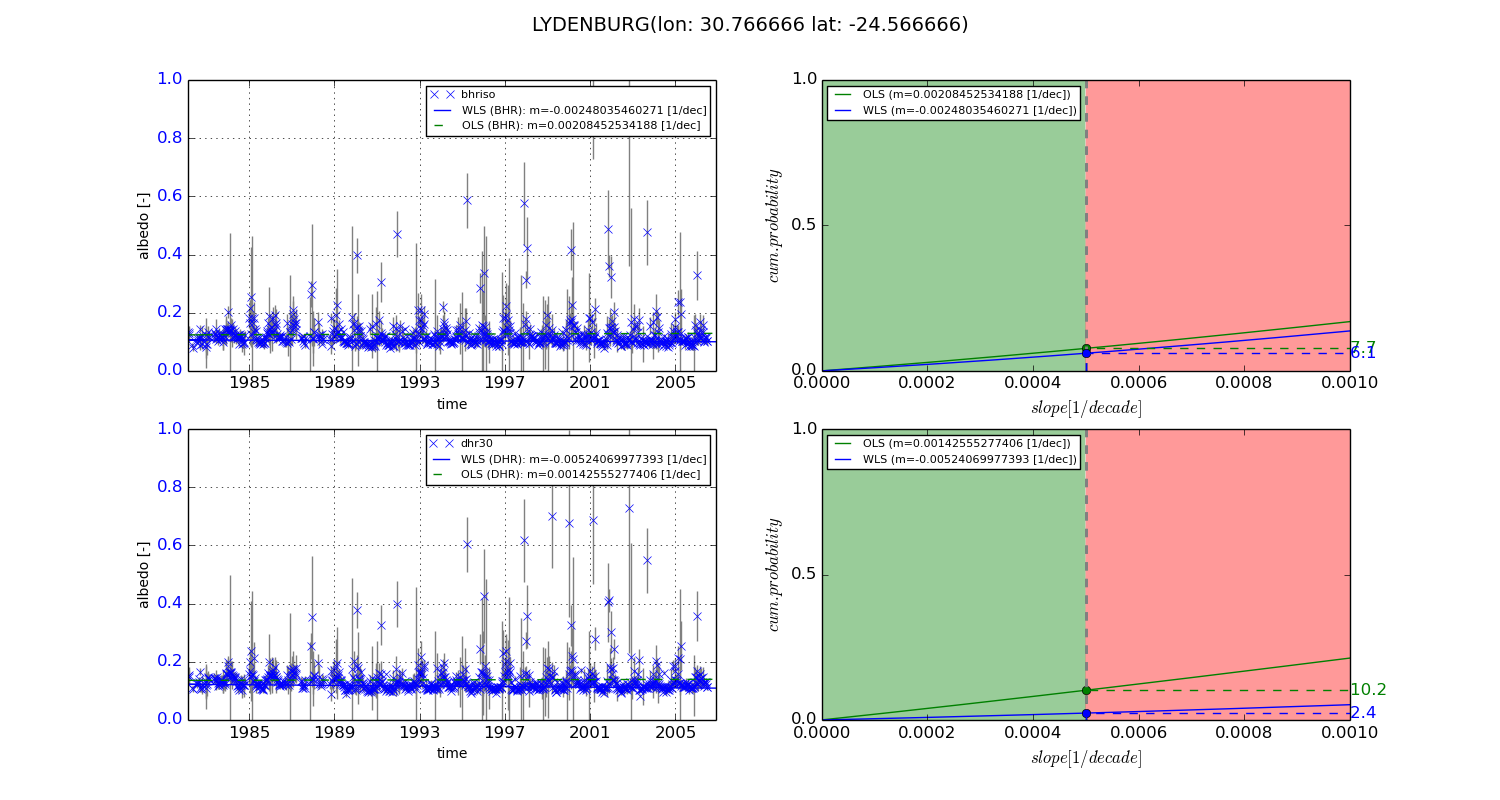
Temporal stability analysis

+000 deg (BHR)


BHR statistics

Temporal stability [1/decade]:


abs

rel


Weighted least square:

-0.00248035460271


Ordinary least square:

0.00208452534188


Probabilities that GCOS criteria is met:

Weighted least square:

6.1 %

Ordinary least square:

7.7 %


DHR statistics

Temporal stability [1/decade]:


abs

rel


Weighted least square:

-0.00524069977393


Ordinary least square:

0.00142555277406


Probabilities that GCOS criteria is met:

Weighted least square:

2.4 %

Ordinary least square:

10.2 %


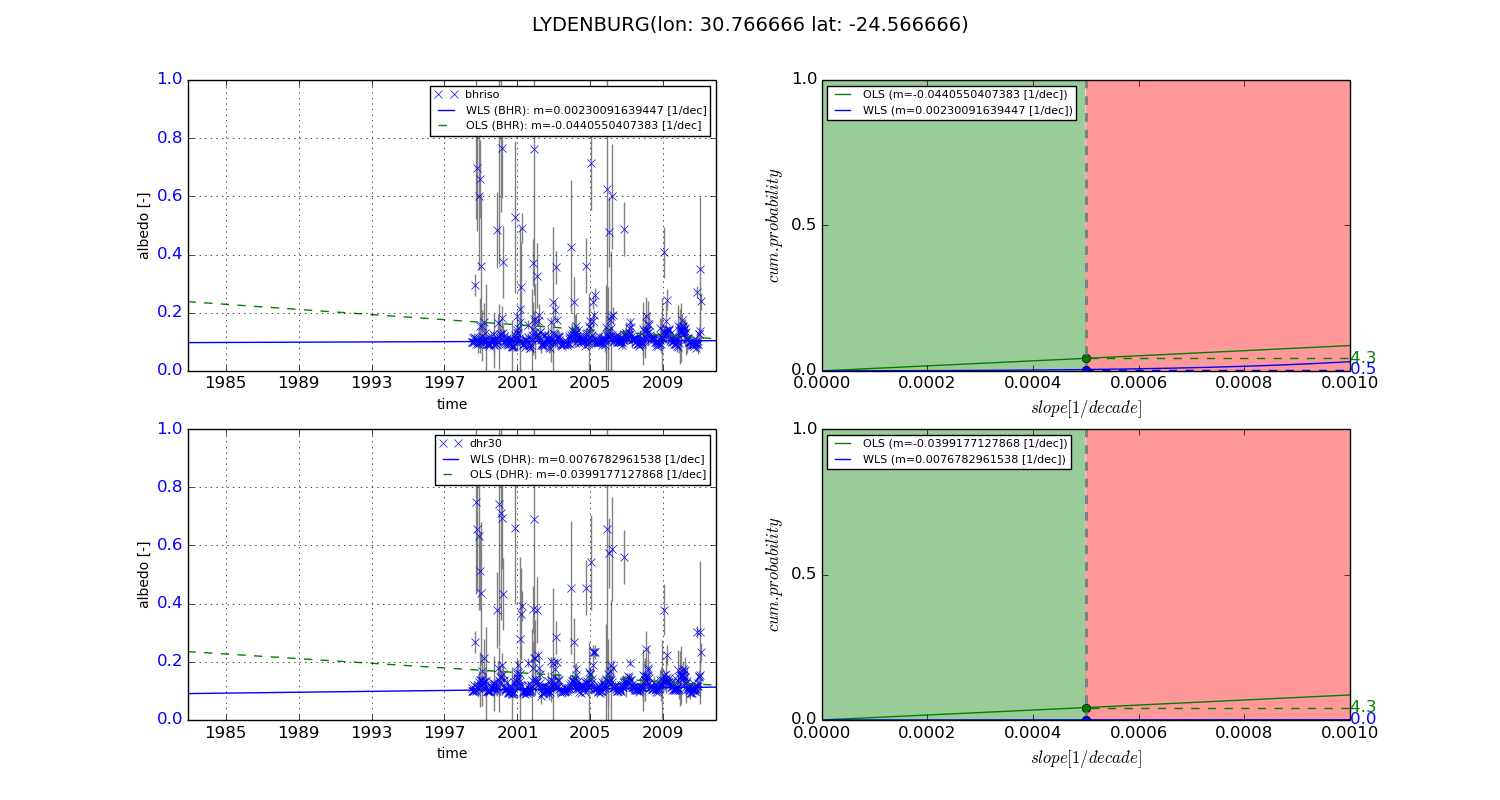
+057/+063 deg (BHR)


BHR statistics

Temporal stability [1/decade]:


abs

rel


Weighted least square:

0.00230091639447


Ordinary least square:

-0.0440550407383


Probabilities that GCOS criteria is met:

Weighted least square:

0.5 %

Ordinary least square:

4.3 %


DHR statistics

Temporal stability [1/decade]:


abs

rel


Weighted least square:

0.0076782961538


Ordinary least square:

-0.0399177127868


Probabilities that GCOS criteria is met:

Weighted least square:

0.0 %

Ordinary least square:

4.3 %


Temporal anomaly analyis

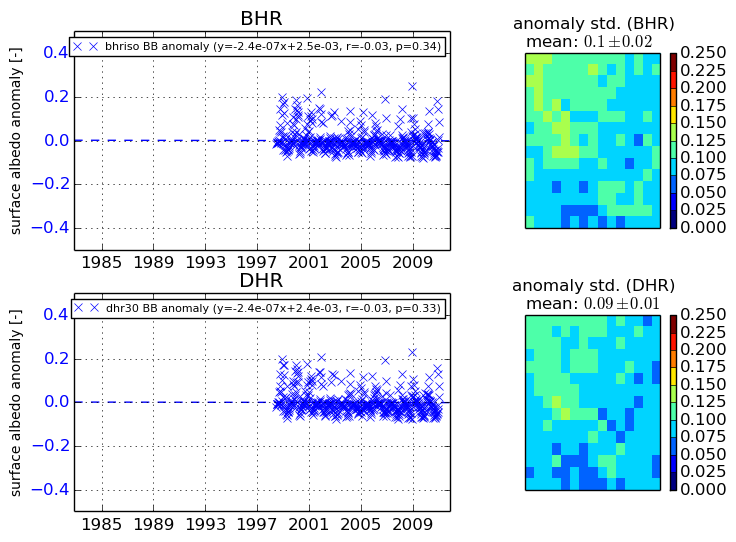
The variance of the temporal anomalies provides an additional measure about the stability of the signal AFTER removal of the mean seasonal cylce.
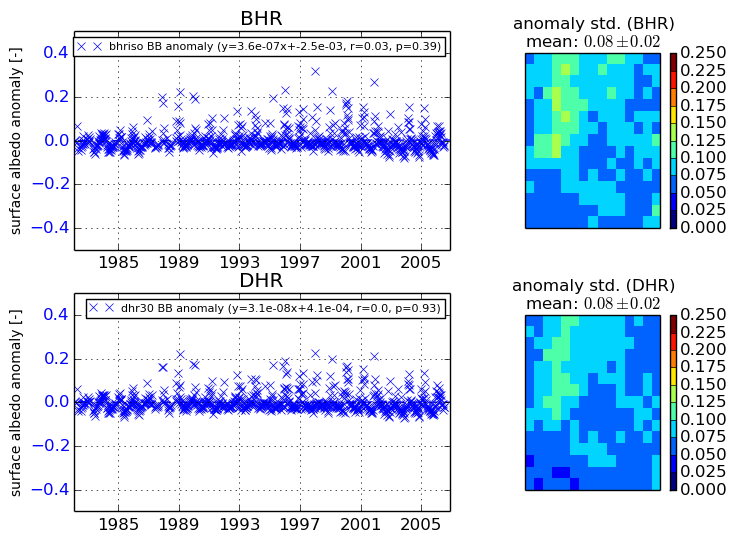
+000 deg


+057/+063 deg