MADISON


Location

lon / lat [deg]: -89.41 / 43.07

Source network: AERONET


Geostationary surface albedo (GSA) data


“+000”


“+057/+063”


Landcover information (based on ESA CCI landcover data)


Landcover fractions @ 2km distance


Landcover fractions @ 20 km distance


Legend


Distance to open water bodies [km]:

1.02

Distance to urban areas [km]:

0.1


Radius: 1 km

Number of landcover classes:

1

Dominant landcover type:

190: urban areas

Fraction of dominant landcover type [%]:

100.0


Radius: 2 km

Number of landcover classes:

2

Dominant landcover type:

190: urban areas

Fraction of dominant landcover type [%]:

68.0


Radius: 5 km

Number of landcover classes:

2

Dominant landcover type:

190: urban areas

Fraction of dominant landcover type [%]:

54.0


Radius: 10 km

Number of landcover classes:

5

Dominant landcover type:

190: urban areas

Fraction of dominant landcover type [%]:

53.0


Radius: 20 km

Number of landcover classes:

6

Dominant landcover type:

10: cropland, rainfed

Fraction of dominant landcover type [%]:

54.0


Disturbances


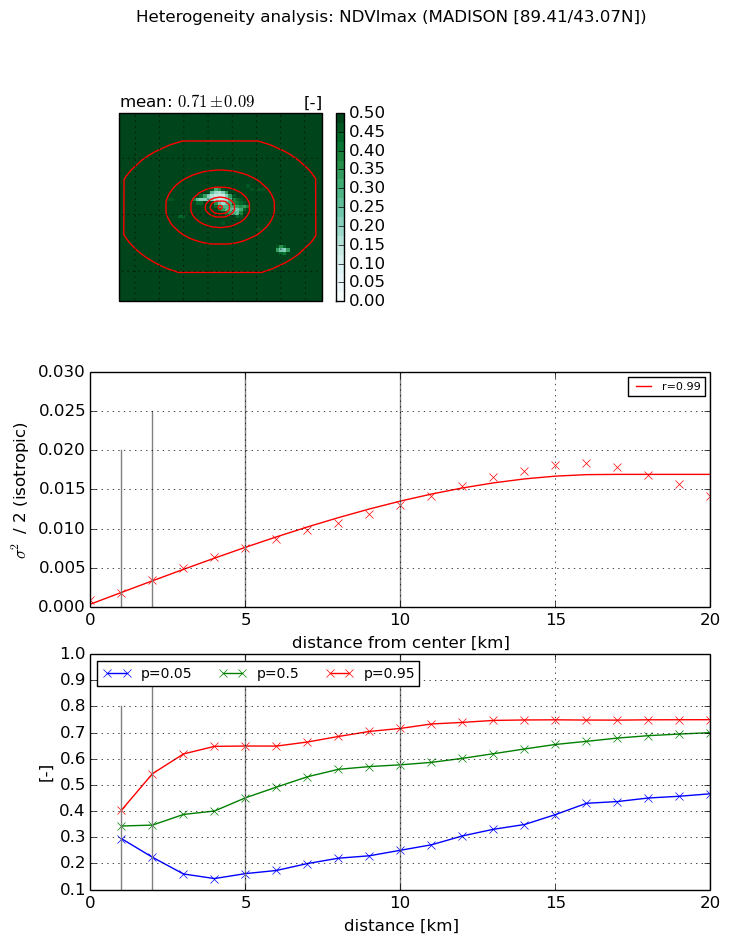
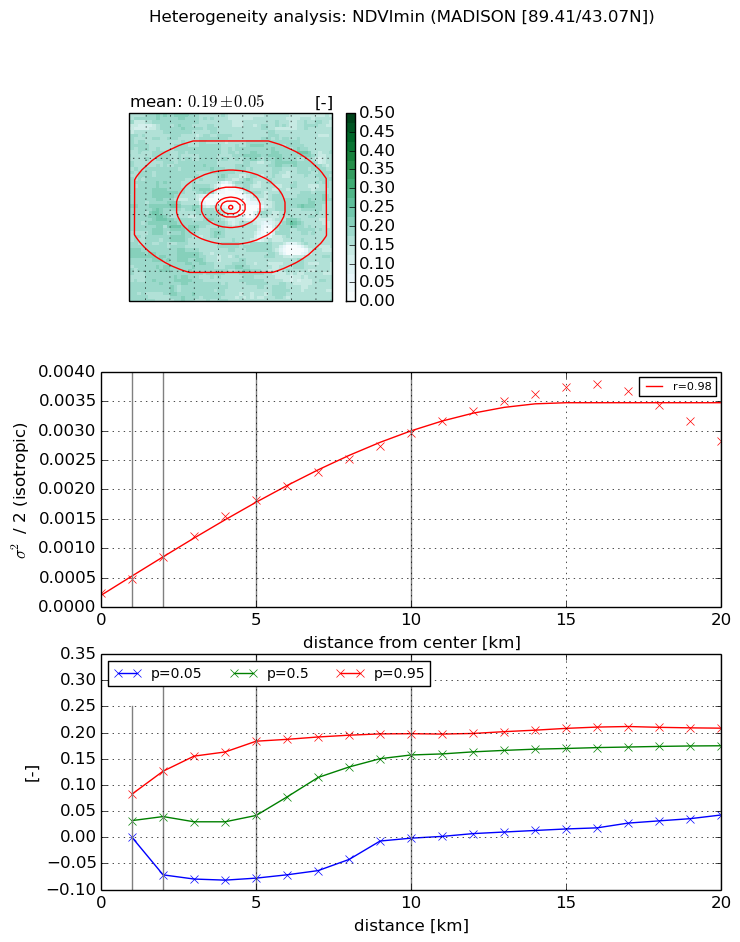
Heterogeneity analysis

The heterogeneity analysis provides information about the spatial and temporal heterogeneity of the site.

Topography


Roman et al. (2009) index


St

16.0334594095

Rcv

0.177215030313

Rse

0.0

Rst

-0.0015062975013

Rsv

-0.00838738798838


Height range @ 1km [m]

24

Height range @ 2km [m]

28

Height range @ 5km [m]

45

Height range @ 10km [m]

-999

Height range @ 20km [m]

-999


Variance slope @ 1 km

60

Variance slope @ 2 km

51

Variance slope @ 5 km

41

Variance slope @ 10 km

-999

Variance slope @ 20 km

-999


NDVI (max. NDVI composite)


Roman et al. (2009) index


St

7.03495121215

Rcv

-0.014223799836

Rse

0.0

Rst

0.0450514187883

Rsv

0.367166971169


NDVI range @ 1km [-]

0.11

NDVI range @ 2km [-]

0.32

NDVI range @ 5km [-]

0.49

NDVI range @ 10km [-]

0.47

NDVI range @ 20km [-]

0.28


Variance slope @ 1 km

0.0010123249569

Variance slope @ 2 km

0.0012857795959

Variance slope @ 5 km

0.00139726566615

Variance slope @ 10 km

0.0012277416724

Variance slope @ 20 km

0.000840282997157


NDVI (min. NDVI composite)I


Roman et al. (2009) index


St

3.80012909882e-07

Rcv

-0.213589809331

Rse

0.0

Rst

0.192406716646

Rsv

7894468.23438


NDVI range @ 1km [-]

0.08

NDVI range @ 2km [-]

0.2

NDVI range @ 5km [-]

0.26

NDVI range @ 10km [-]

0.2

NDVI range @ 20km [-]

0.17


NDVI slope @ 1 km

0.000243742313431

NDVI slope @ 2 km

0.000306441716242

NDVI slope @ 5 km

0.000327642674128

NDVI slope @ 10 km

0.000276664032799

NDVI slope @ 20 km

0.000160233620569


Temporal stability analysis

+000 deg (BHR)


BHR statistics

Temporal stability [1/decade]:


abs

rel


Weighted least square:

None


Ordinary least square:

None


Probabilities that GCOS criteria is met:

Weighted least square:

None %

Ordinary least square:

None %


DHR statistics

Temporal stability [1/decade]:


abs

rel


Weighted least square:

None


Ordinary least square:

None


Probabilities that GCOS criteria is met:

Weighted least square:

None %

Ordinary least square:

None %


+057/+063 deg (BHR)


BHR statistics

Temporal stability [1/decade]:


abs

rel


Weighted least square:

None


Ordinary least square:

None


Probabilities that GCOS criteria is met:

Weighted least square:

None %

Ordinary least square:

None %


DHR statistics

Temporal stability [1/decade]:


abs

rel


Weighted least square:

None


Ordinary least square:

None


Probabilities that GCOS criteria is met:

Weighted least square:

None %

Ordinary least square:

None %


Temporal anomaly analyis

The variance of the temporal anomalies provides an additional measure about the stability of the signal AFTER removal of the mean seasonal cylce.

+000 deg


+057/+063 deg