MADRID


Location

lon / lat [deg]: -3.724 / 40.4519

Source network: AERONET


Geostationary surface albedo (GSA) data


“+000”


“+057/+063”


Landcover information (based on ESA CCI landcover data)


Landcover fractions @ 2km distance


Landcover fractions @ 20 km distance


Legend


Distance to open water bodies [km]:

11.23

Distance to urban areas [km]:

0.06


Radius: 1 km

Number of landcover classes:

1

Dominant landcover type:

190: urban areas

Fraction of dominant landcover type [%]:

100.0


Radius: 2 km

Number of landcover classes:

1

Dominant landcover type:

190: urban areas

Fraction of dominant landcover type [%]:

100.0


Radius: 5 km

Number of landcover classes:

3

Dominant landcover type:

190: urban areas

Fraction of dominant landcover type [%]:

96.0


Radius: 10 km

Number of landcover classes:

5

Dominant landcover type:

190: urban areas

Fraction of dominant landcover type [%]:

78.0


Radius: 20 km

Number of landcover classes:

9

Dominant landcover type:

190: urban areas

Fraction of dominant landcover type [%]:

54.0


Disturbances


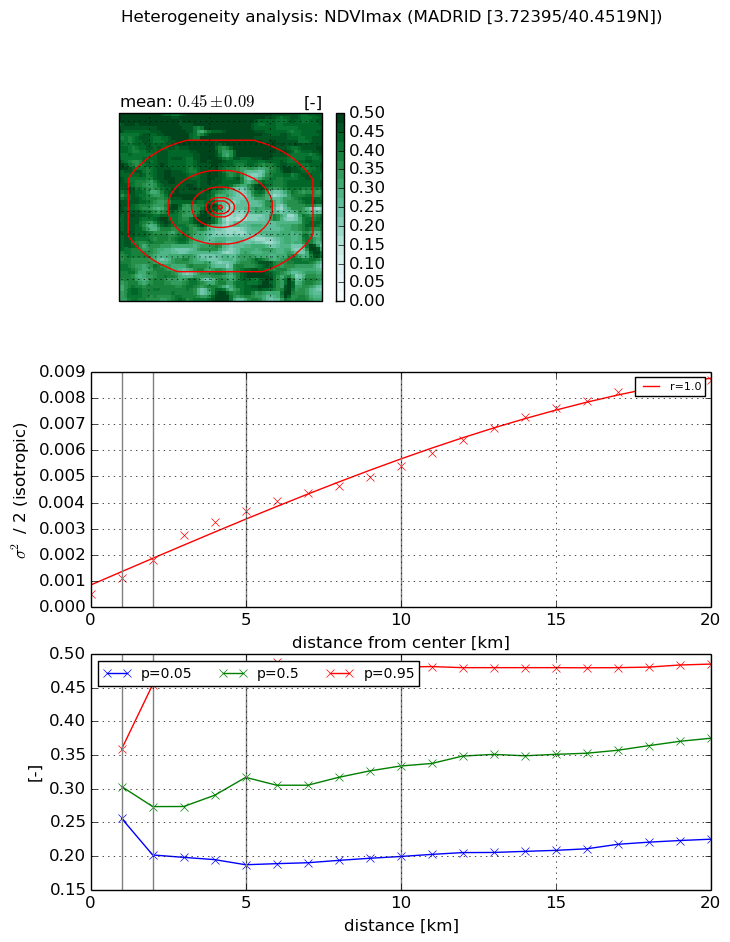
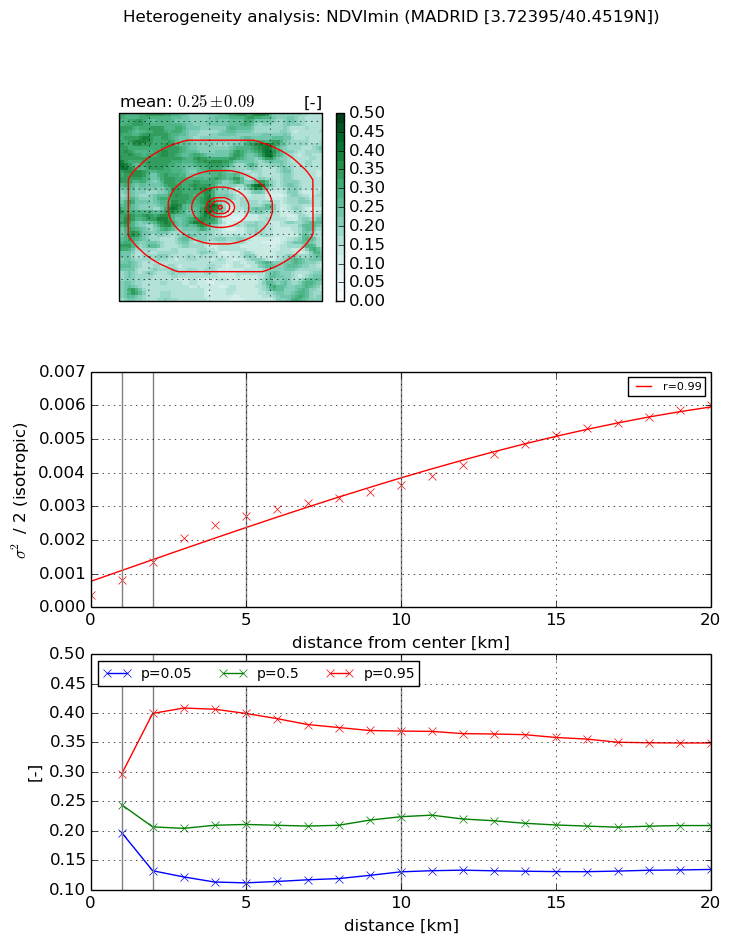
Heterogeneity analysis

The heterogeneity analysis provides information about the spatial and temporal heterogeneity of the site.

Topography


Roman et al. (2009) index


St

2.62604409273

Rcv

-0.0334142305325

Rse

0.0

Rst

-0.10899395309

Rsv

-0.999994568982


Height range @ 1km [m]

76

Height range @ 2km [m]

125

Height range @ 5km [m]

132

Height range @ 10km [m]

-999

Height range @ 20km [m]

-999


Variance slope @ 1 km

289

Variance slope @ 2 km

315

Variance slope @ 5 km

370

Variance slope @ 10 km

-999

Variance slope @ 20 km

-999


NDVI (max. NDVI composite)


Roman et al. (2009) index


St

2.55060564023e-07

Rcv

-0.0355576481176

Rse

0.0

Rst

0.321755590692

Rsv

11761912.0006


NDVI range @ 1km [-]

0.1

NDVI range @ 2km [-]

0.25

NDVI range @ 5km [-]

0.3

NDVI range @ 10km [-]

0.28

NDVI range @ 20km [-]

0.26


Variance slope @ 1 km

0.000607720754728

Variance slope @ 2 km

0.0006563421863

Variance slope @ 5 km

0.000662553407873

Variance slope @ 10 km

0.000476557529449

Variance slope @ 20 km

0.000405307108045


NDVI (min. NDVI composite)I


Roman et al. (2009) index


St

1.05004042542e-06

Rcv

-0.062372283261

Rse

0.0

Rst

0.257960424272

Rsv

2857032.53991


NDVI range @ 1km [-]

0.1

NDVI range @ 2km [-]

0.27

NDVI range @ 5km [-]

0.29

NDVI range @ 10km [-]

0.24

NDVI range @ 20km [-]

0.22


NDVI slope @ 1 km

0.000454943589779

NDVI slope @ 2 km

0.000494310703812

NDVI slope @ 5 km

0.000492129747573

NDVI slope @ 10 km

0.000317937683908

NDVI slope @ 20 km

0.000264948017597


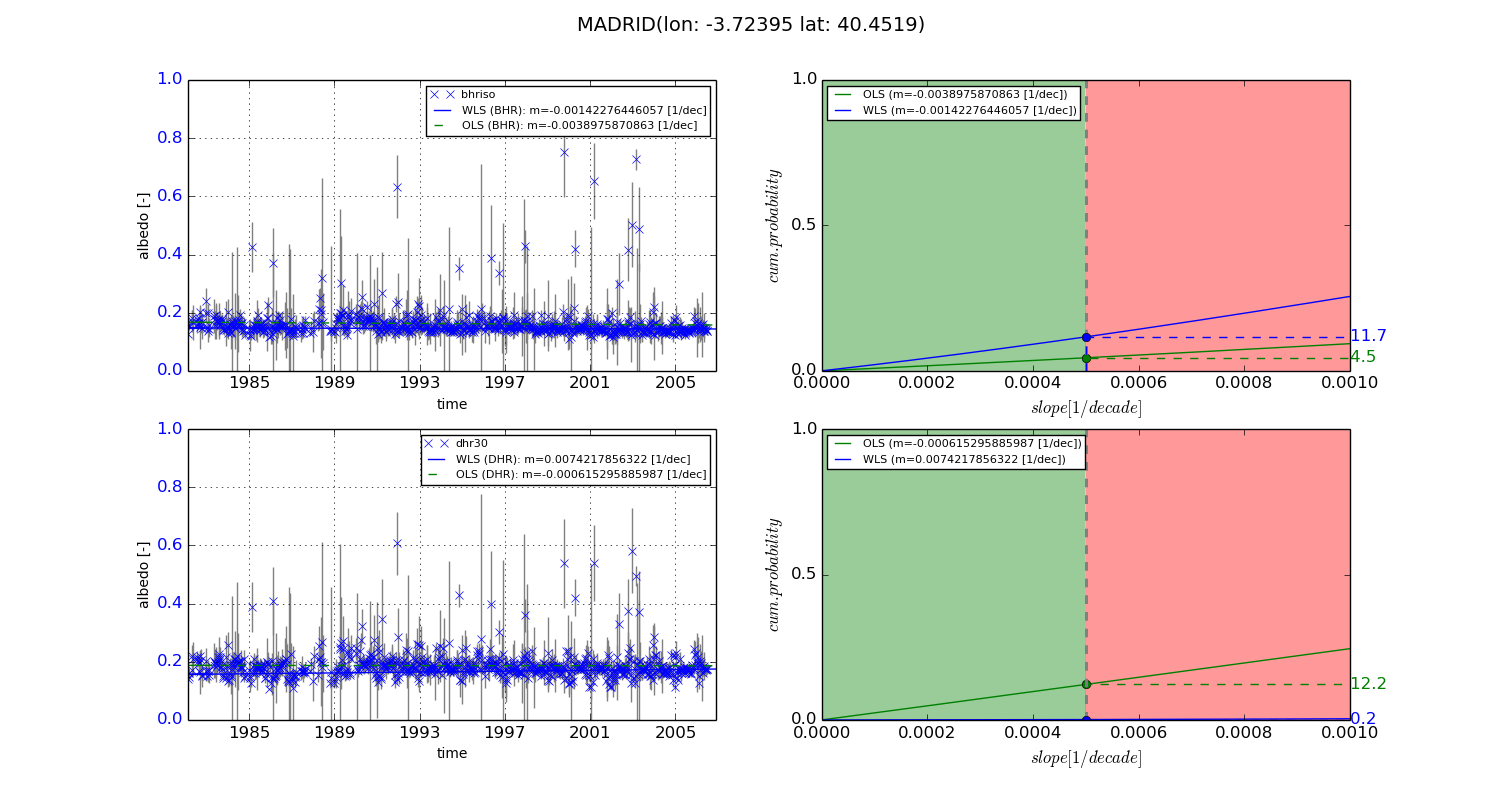
Temporal stability analysis

+000 deg (BHR)


BHR statistics

Temporal stability [1/decade]:


abs

rel


Weighted least square:

-0.00142276446057


Ordinary least square:

-0.0038975870863


Probabilities that GCOS criteria is met:

Weighted least square:

11.7 %

Ordinary least square:

4.5 %


DHR statistics

Temporal stability [1/decade]:


abs

rel


Weighted least square:

0.0074217856322


Ordinary least square:

-0.000615295885987


Probabilities that GCOS criteria is met:

Weighted least square:

0.2 %

Ordinary least square:

12.2 %


+057/+063 deg (BHR)


BHR statistics

Temporal stability [1/decade]:


abs

rel


Weighted least square:

-99999.0


Ordinary least square:

-99999.0


Probabilities that GCOS criteria is met:

Weighted least square:

-99999.0 %

Ordinary least square:

-99999.0 %


DHR statistics

Temporal stability [1/decade]:


abs

rel


Weighted least square:

-99999.0


Ordinary least square:

-99999.0


Probabilities that GCOS criteria is met:

Weighted least square:

-99999.0 %

Ordinary least square:

-99999.0 %


Temporal anomaly analyis

The variance of the temporal anomalies provides an additional measure about the stability of the signal AFTER removal of the mean seasonal cylce.
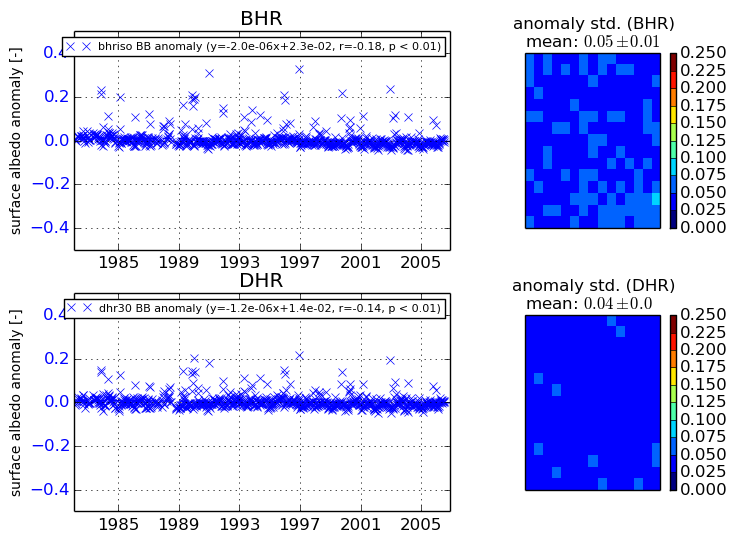
+000 deg


+057/+063 deg