MAESON


Location

lon / lat [deg]: 99.1707 / 19.8305

Source network: AERONET


Geostationary surface albedo (GSA) data


“+000”


“+057/+063”


Landcover information (based on ESA CCI landcover data)


Landcover fractions @ 2km distance


Landcover fractions @ 20 km distance


Legend


Distance to open water bodies [km]:

17.26

Distance to urban areas [km]:

0.34


Radius: 1 km

Number of landcover classes:

4

Dominant landcover type:

10: cropland, rainfed

Fraction of dominant landcover type [%]:

68.0


Radius: 2 km

Number of landcover classes:

4

Dominant landcover type:

10: cropland, rainfed

Fraction of dominant landcover type [%]:

63.0


Radius: 5 km

Number of landcover classes:

6

Dominant landcover type:

10: cropland, rainfed

Fraction of dominant landcover type [%]:

51.0


Radius: 10 km

Number of landcover classes:

8

Dominant landcover type:

10: cropland, rainfed

Fraction of dominant landcover type [%]:

41.0


Radius: 20 km

Number of landcover classes:

8

Dominant landcover type:

10: cropland, rainfed

Fraction of dominant landcover type [%]:

22.0


Disturbances


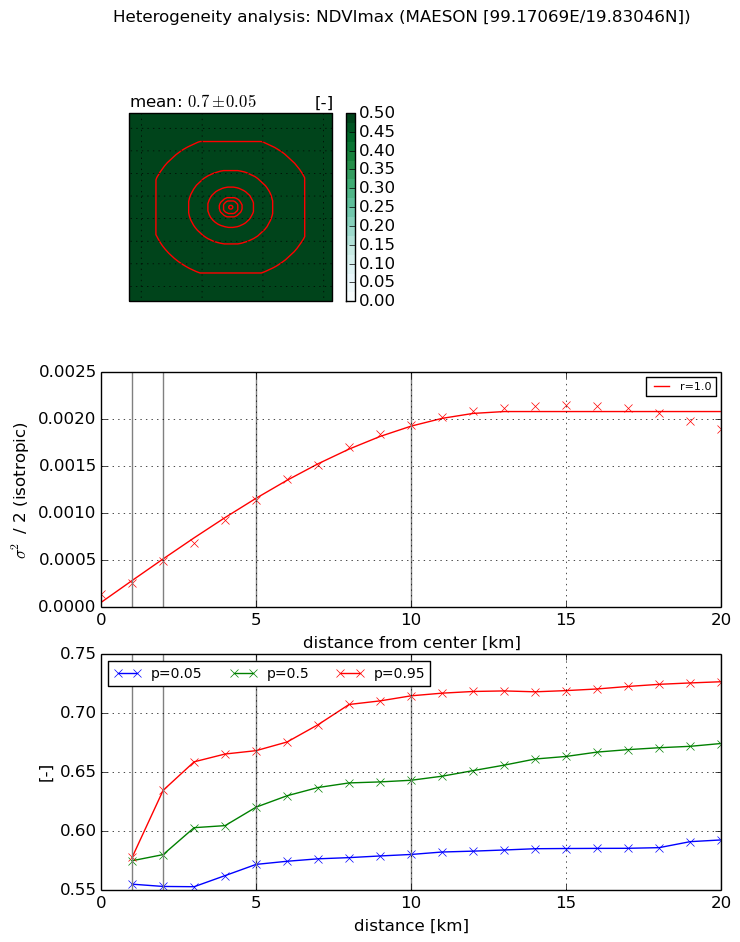
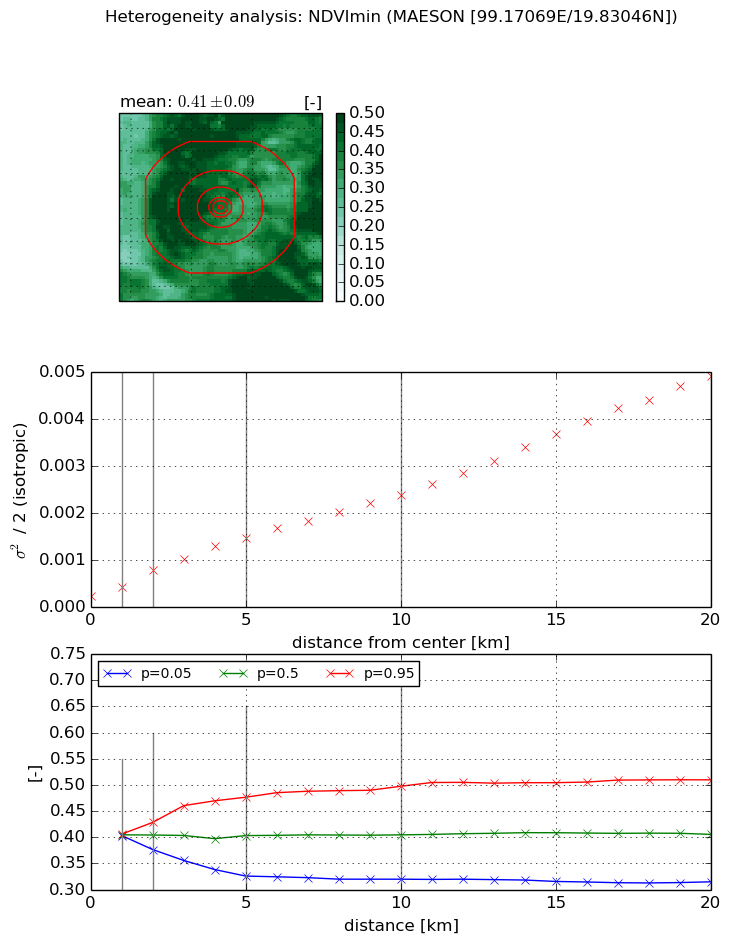
Heterogeneity analysis

The heterogeneity analysis provides information about the spatial and temporal heterogeneity of the site.

Topography


Roman et al. (2009) index


St

3.65100434258

Rcv

0.541411840139

Rse

0.0

Rst

-0.0169845869546

Rsv

0.263295282504


Height range @ 1km [m]

18

Height range @ 2km [m]

35

Height range @ 5km [m]

66

Height range @ 10km [m]

-999

Height range @ 20km [m]

-999


Variance slope @ 1 km

157

Variance slope @ 2 km

146

Variance slope @ 5 km

158

Variance slope @ 10 km

-999

Variance slope @ 20 km

-999


NDVI (max. NDVI composite)


Roman et al. (2009) index


St

5.77410905078

Rcv

-0.00929957399403

Rse

0.0

Rst

-0.1022899289

Rsv

0.407971172807


NDVI range @ 1km [-]

0.02

NDVI range @ 2km [-]

0.08

NDVI range @ 5km [-]

0.1

NDVI range @ 10km [-]

0.13

NDVI range @ 20km [-]

0.13


Variance slope @ 1 km

0.000112221964378

Variance slope @ 2 km

0.000177773857979

Variance slope @ 5 km

0.000205900963202

Variance slope @ 10 km

0.000191273543463

Variance slope @ 20 km

9.58070126481e-05


NDVI (min. NDVI composite)I


Roman et al. (2009) index


St

2.06941590967

Rcv

0.531920825767

Rse

0.0

Rst

0.0670898037515

Rsv

0.850673789155


NDVI range @ 1km [-]

0.0

NDVI range @ 2km [-]

0.05

NDVI range @ 5km [-]

0.15

NDVI range @ 10km [-]

0.18

NDVI range @ 20km [-]

0.2


NDVI slope @ 1 km

0.000191144578754

NDVI slope @ 2 km

0.000274316537505

NDVI slope @ 5 km

0.000258817793615

NDVI slope @ 10 km

0.000214168247695

NDVI slope @ 20 km

0.000229047271401


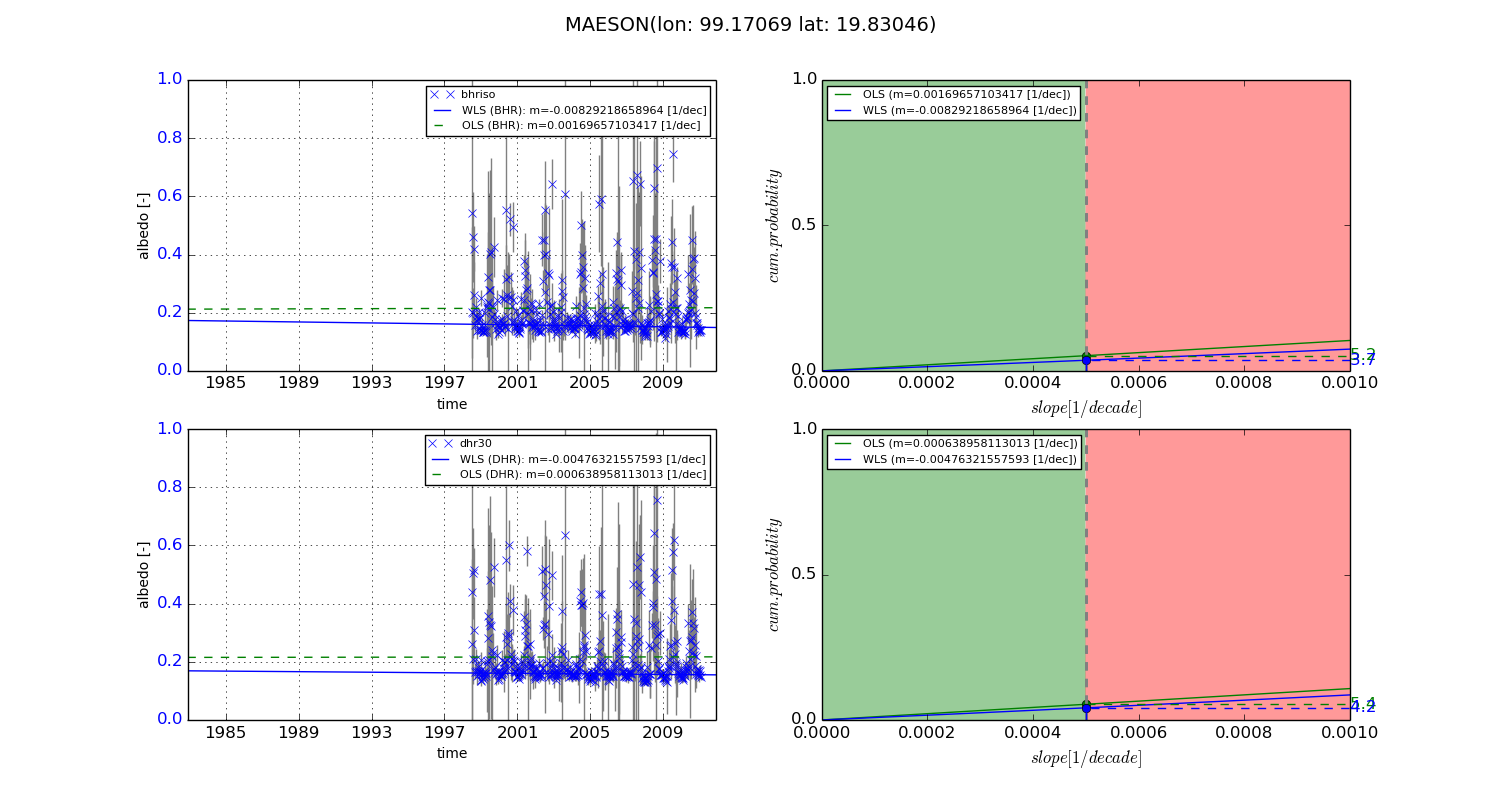
Temporal stability analysis

+000 deg (BHR)


BHR statistics

Temporal stability [1/decade]:


abs

rel


Weighted least square:

None


Ordinary least square:

None


Probabilities that GCOS criteria is met:

Weighted least square:

None %

Ordinary least square:

None %


DHR statistics

Temporal stability [1/decade]:


abs

rel


Weighted least square:

None


Ordinary least square:

None


Probabilities that GCOS criteria is met:

Weighted least square:

None %

Ordinary least square:

None %


+057/+063 deg (BHR)


BHR statistics

Temporal stability [1/decade]:


abs

rel


Weighted least square:

-0.00829218658964


Ordinary least square:

0.00169657103417


Probabilities that GCOS criteria is met:

Weighted least square:

3.7 %

Ordinary least square:

5.2 %


DHR statistics

Temporal stability [1/decade]:


abs

rel


Weighted least square:

-0.00476321557593


Ordinary least square:

0.000638958113013


Probabilities that GCOS criteria is met:

Weighted least square:

4.2 %

Ordinary least square:

5.4 %


Temporal anomaly analyis

The variance of the temporal anomalies provides an additional measure about the stability of the signal AFTER removal of the mean seasonal cylce.

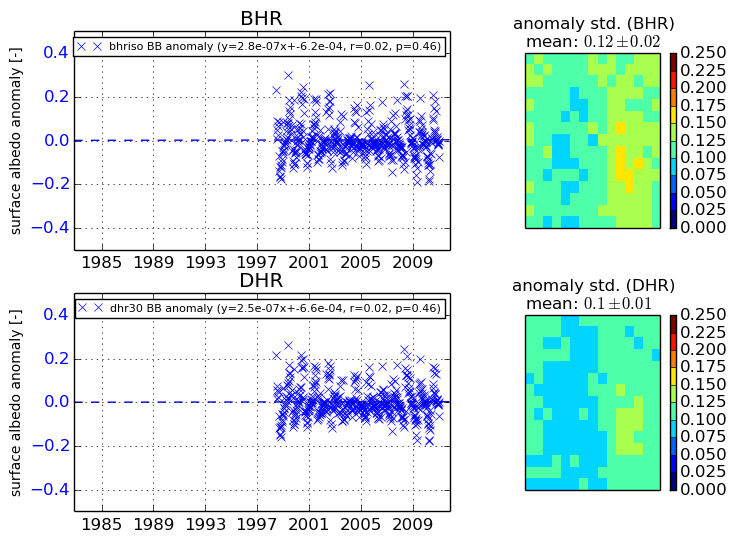
+000 deg


+057/+063 deg