MAGGIE_VALLEY


Location

lon / lat [deg]: -83.0947 / 35.5198

Source network: AERONET


Geostationary surface albedo (GSA) data


“+000”


“+057/+063”


Landcover information (based on ESA CCI landcover data)


Landcover fractions @ 2km distance


Landcover fractions @ 20 km distance


Legend


Distance to open water bodies [km]:

10.25

Distance to urban areas [km]:

0.15


Radius: 1 km

Number of landcover classes:

4

Dominant landcover type:

130: grassland

Fraction of dominant landcover type [%]:

82.0


Radius: 2 km

Number of landcover classes:

4

Dominant landcover type:

130: grassland

Fraction of dominant landcover type [%]:

50.0


Radius: 5 km

Number of landcover classes:

4

Dominant landcover type:

60: Tree cover, broadleaved, decidous

Fraction of dominant landcover type [%]:

72.0


Radius: 10 km

Number of landcover classes:

4

Dominant landcover type:

60: Tree cover, broadleaved, decidous

Fraction of dominant landcover type [%]:

69.0


Radius: 20 km

Number of landcover classes:

4

Dominant landcover type:

60: Tree cover, broadleaved, decidous

Fraction of dominant landcover type [%]:

69.0


Disturbances


Heterogeneity analysis

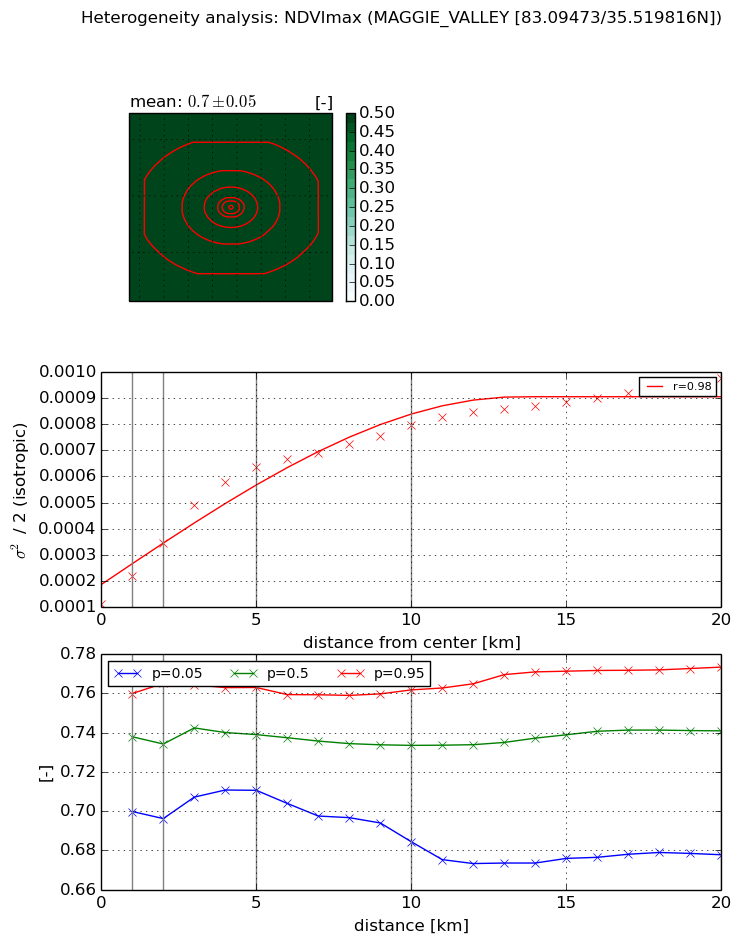
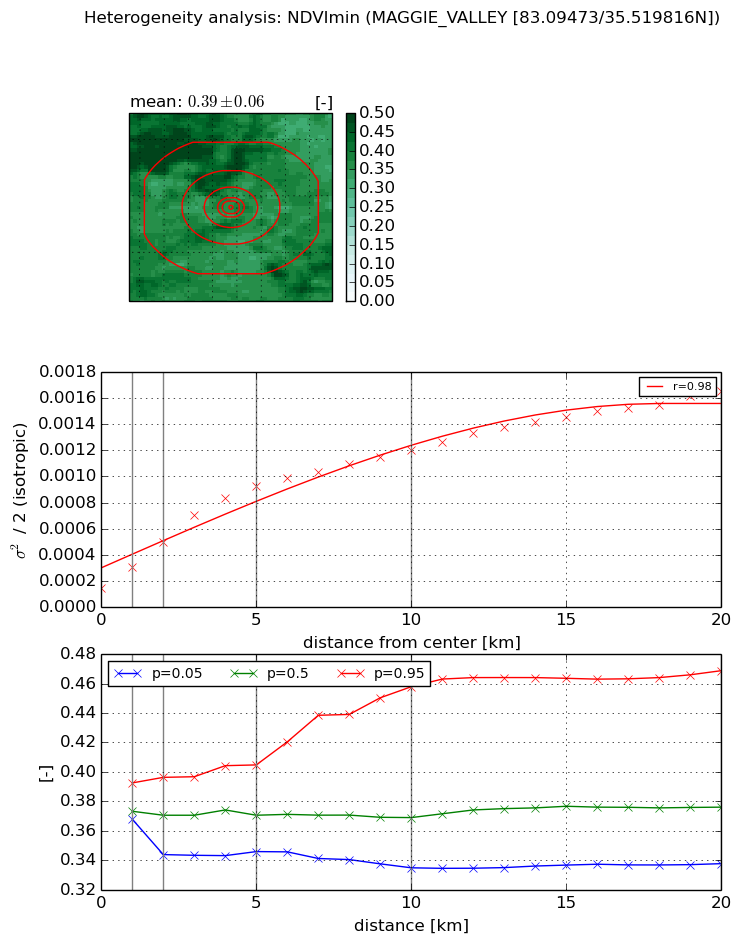
The heterogeneity analysis provides information about the spatial and temporal heterogeneity of the site.

Topography


Roman et al. (2009) index


St

3.11953471592

Rcv

0.211493272493

Rse

0.0

Rst

-0.0268838371471

Rsv

0.723304767049


Height range @ 1km [m]

210

Height range @ 2km [m]

400

Height range @ 5km [m]

682

Height range @ 10km [m]

-999

Height range @ 20km [m]

-999


Variance slope @ 1 km

15850

Variance slope @ 2 km

17041

Variance slope @ 5 km

11897

Variance slope @ 10 km

-999

Variance slope @ 20 km

-999


NDVI (max. NDVI composite)


Roman et al. (2009) index


St

1.29619329133

Rcv

-0.0722356490706

Rse

0.0

Rst

-0.519632104055

Rsv

1.72260187117


NDVI range @ 1km [-]

0.06

NDVI range @ 2km [-]

0.07

NDVI range @ 5km [-]

0.05

NDVI range @ 10km [-]

0.08

NDVI range @ 20km [-]

0.1


Variance slope @ 1 km

0.000107555665584

Variance slope @ 2 km

0.000116278169639

Variance slope @ 5 km

0.000109828154841

Variance slope @ 10 km

6.52884086732e-05

Variance slope @ 20 km

3.62746019519e-05


NDVI (min. NDVI composite)I


Roman et al. (2009) index


St

nan

Rcv

nan

Rse

nan

Rst

nan

Rsv

nan


NDVI range @ 1km [-]

0.02

NDVI range @ 2km [-]

0.05

NDVI range @ 5km [-]

0.06

NDVI range @ 10km [-]

0.12

NDVI range @ 20km [-]

0.13


NDVI slope @ 1 km

0.000161010521657

NDVI slope @ 2 km

0.00017437004974

NDVI slope @ 5 km

0.000163180454928

NDVI slope @ 10 km

0.000102134940392

NDVI slope @ 20 km

6.60593679543e-05


Temporal stability analysis

+000 deg (BHR)


BHR statistics

Temporal stability [1/decade]:


abs

rel


Weighted least square:

None


Ordinary least square:

None


Probabilities that GCOS criteria is met:

Weighted least square:

None %

Ordinary least square:

None %


DHR statistics

Temporal stability [1/decade]:


abs

rel


Weighted least square:

None


Ordinary least square:

None


Probabilities that GCOS criteria is met:

Weighted least square:

None %

Ordinary least square:

None %


+057/+063 deg (BHR)


BHR statistics

Temporal stability [1/decade]:


abs

rel


Weighted least square:

None


Ordinary least square:

None


Probabilities that GCOS criteria is met:

Weighted least square:

None %

Ordinary least square:

None %


DHR statistics

Temporal stability [1/decade]:


abs

rel


Weighted least square:

None


Ordinary least square:

None


Probabilities that GCOS criteria is met:

Weighted least square:

None %

Ordinary least square:

None %


Temporal anomaly analyis

The variance of the temporal anomalies provides an additional measure about the stability of the signal AFTER removal of the mean seasonal cylce.

+000 deg


+057/+063 deg