MAMMOTH_LAKE


Location

lon / lat [deg]: -119.0333 / 37.6167

Source network: AERONET


Geostationary surface albedo (GSA) data


“+000”


“+057/+063”


Landcover information (based on ESA CCI landcover data)


Landcover fractions @ 2km distance


Landcover fractions @ 20 km distance


Legend


Distance to open water bodies [km]:

1.09

Distance to urban areas [km]:

3.9


Radius: 1 km

Number of landcover classes:

2

Dominant landcover type:

70: Tree cover, needleleaved, evergreen, closed to open (>15%)

Fraction of dominant landcover type [%]:

75.0


Radius: 2 km

Number of landcover classes:

2

Dominant landcover type:

70: Tree cover, needleleaved, evergreen, closed to open (>15%)

Fraction of dominant landcover type [%]:

65.0


Radius: 5 km

Number of landcover classes:

5

Dominant landcover type:

70: Tree cover, needleleaved, evergreen, closed to open (>15%)

Fraction of dominant landcover type [%]:

66.0


Radius: 10 km

Number of landcover classes:

5

Dominant landcover type:

70: Tree cover, needleleaved, evergreen, closed to open (>15%)

Fraction of dominant landcover type [%]:

71.0


Radius: 20 km

Number of landcover classes:

5

Dominant landcover type:

70: Tree cover, needleleaved, evergreen, closed to open (>15%)

Fraction of dominant landcover type [%]:

58.0


Disturbances


Heterogeneity analysis

The heterogeneity analysis provides information about the spatial and temporal heterogeneity of the site.

Topography


Roman et al. (2009) index


St

1.86768720958

Rcv

0.465415584626

Rse

0.0

Rst

-0.0372556632969

Rsv

1.10359343313


Height range @ 1km [m]

312

Height range @ 2km [m]

510

Height range @ 5km [m]

794

Height range @ 10km [m]

-999

Height range @ 20km [m]

-999


Variance slope @ 1 km

11629

Variance slope @ 2 km

15622

Variance slope @ 5 km

16750

Variance slope @ 10 km

-999

Variance slope @ 20 km

-999


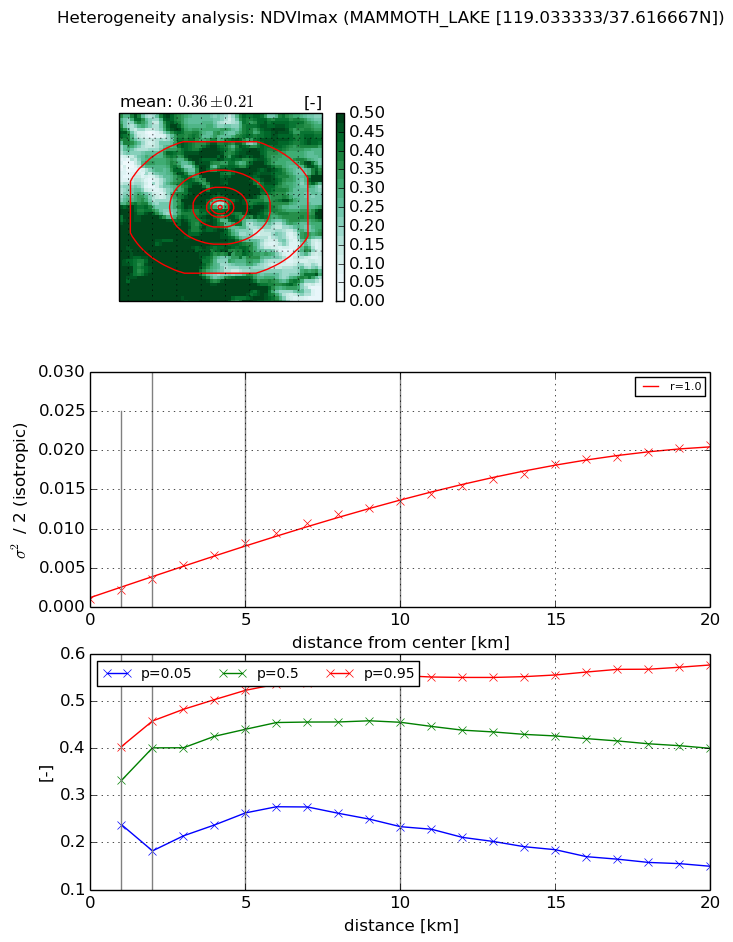
NDVI (max. NDVI composite)


Roman et al. (2009) index


St

13.1133561813

Rcv

-0.206153048709

Rse

0.0

Rst

0.00628520060515

Rsv

0.0163361360166


NDVI range @ 1km [-]

0.17

NDVI range @ 2km [-]

0.28

NDVI range @ 5km [-]

0.26

NDVI range @ 10km [-]

0.32

NDVI range @ 20km [-]

0.43


Variance slope @ 1 km

0.0011823857583

Variance slope @ 2 km

0.00128281302128

Variance slope @ 5 km

0.00144921887014

Variance slope @ 10 km

0.0012954493933

Variance slope @ 20 km

0.000992592269252


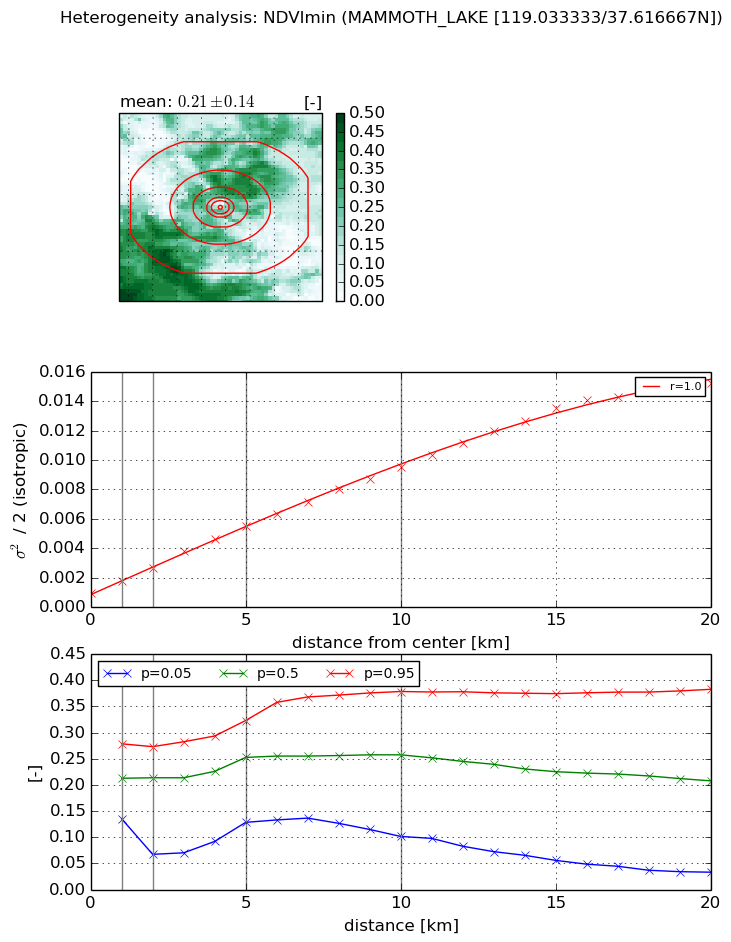
NDVI (min. NDVI composite)I


Roman et al. (2009) index


St

7.15896283065

Rcv

-0.140792461973

Rse

0.0

Rst

-0.0569248662553

Rsv

0.22133778785


NDVI range @ 1km [-]

0.14

NDVI range @ 2km [-]

0.21

NDVI range @ 5km [-]

0.19

NDVI range @ 10km [-]

0.28

NDVI range @ 20km [-]

0.35


NDVI slope @ 1 km

0.000804148320511

NDVI slope @ 2 km

0.000850968020858

NDVI slope @ 5 km

0.000922706697343

NDVI slope @ 10 km

0.00086528833579

NDVI slope @ 20 km

0.000750002849254


Temporal stability analysis

+000 deg (BHR)


BHR statistics

Temporal stability [1/decade]:


abs

rel


Weighted least square:

None


Ordinary least square:

None


Probabilities that GCOS criteria is met:

Weighted least square:

None %

Ordinary least square:

None %


DHR statistics

Temporal stability [1/decade]:


abs

rel


Weighted least square:

None


Ordinary least square:

None


Probabilities that GCOS criteria is met:

Weighted least square:

None %

Ordinary least square:

None %


+057/+063 deg (BHR)


BHR statistics

Temporal stability [1/decade]:


abs

rel


Weighted least square:

None


Ordinary least square:

None


Probabilities that GCOS criteria is met:

Weighted least square:

None %

Ordinary least square:

None %


DHR statistics

Temporal stability [1/decade]:


abs

rel


Weighted least square:

None


Ordinary least square:

None


Probabilities that GCOS criteria is met:

Weighted least square:

None %

Ordinary least square:

None %


Temporal anomaly analyis

The variance of the temporal anomalies provides an additional measure about the stability of the signal AFTER removal of the mean seasonal cylce.

+000 deg


+057/+063 deg


By continuing to use this website, you are giving consent to analytic cookies being used. For more information on how EUMETSAT uses data and how you can disable this, please view this web page: Analytics Cookie Policy