MANDALGOBI


Location

lon / lat [deg]: 106.327 / 45.995

Source network: EOS_LAND


Geostationary surface albedo (GSA) data


“+000”


“+057/+063”


Landcover information (based on ESA CCI landcover data)


Landcover fractions @ 2km distance


Landcover fractions @ 20 km distance


Legend


Distance to open water bodies [km]:

22.53

Distance to urban areas [km]:

23.78


Radius: 1 km

Number of landcover classes:

1

Dominant landcover type:

200: bare areas

Fraction of dominant landcover type [%]:

100.0


Radius: 2 km

Number of landcover classes:

1

Dominant landcover type:

200: bare areas

Fraction of dominant landcover type [%]:

100.0


Radius: 5 km

Number of landcover classes:

1

Dominant landcover type:

200: bare areas

Fraction of dominant landcover type [%]:

100.0


Radius: 10 km

Number of landcover classes:

1

Dominant landcover type:

200: bare areas

Fraction of dominant landcover type [%]:

100.0


Radius: 20 km

Number of landcover classes:

2

Dominant landcover type:

200: bare areas

Fraction of dominant landcover type [%]:

99.0


Disturbances


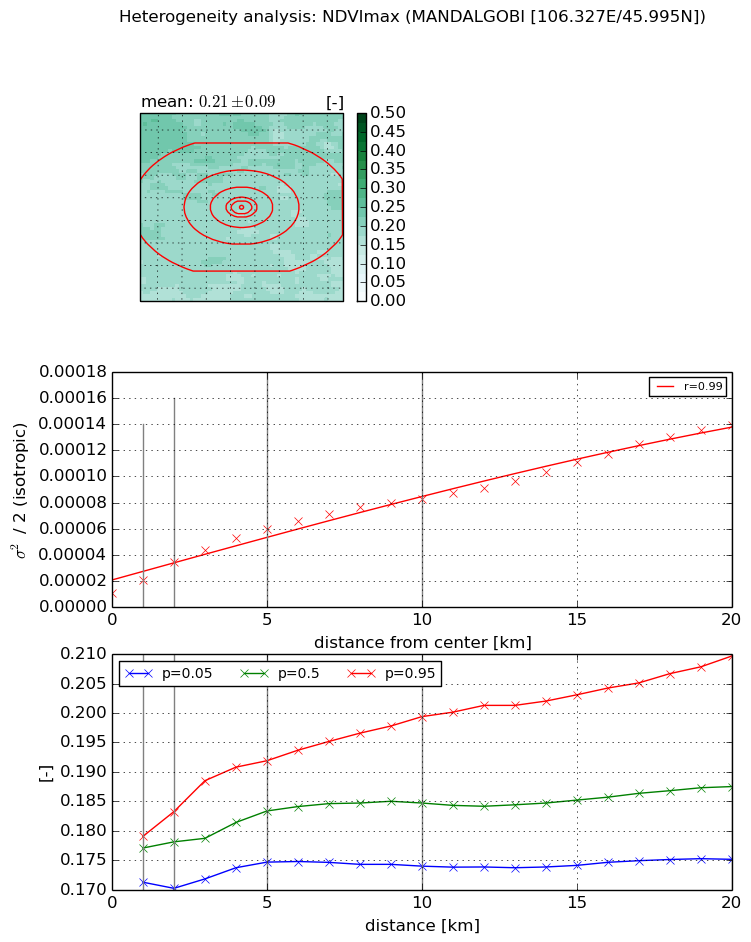
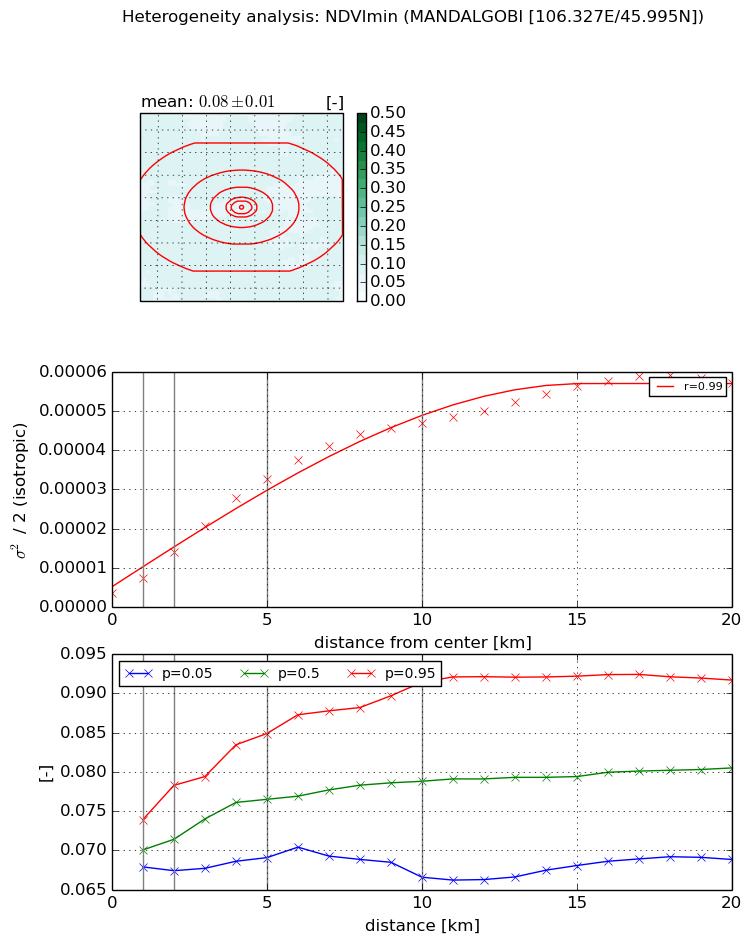
Heterogeneity analysis

The heterogeneity analysis provides information about the spatial and temporal heterogeneity of the site.

Topography


Roman et al. (2009) index


St

4.98858122717

Rcv

0.295435111404

Rse

0.0

Rst

-0.0570527616058

Rsv

0.248885516214


Height range @ 1km [m]

27

Height range @ 2km [m]

36

Height range @ 5km [m]

68

Height range @ 10km [m]

-999

Height range @ 20km [m]

-999


Variance slope @ 1 km

109

Variance slope @ 2 km

124

Variance slope @ 5 km

104

Variance slope @ 10 km

-999

Variance slope @ 20 km

-999


NDVI (max. NDVI composite)


Roman et al. (2009) index


St

7.62524627022

Rcv

-0.00231270925724

Rse

0.0

Rst

-0.0980750280757

Rsv

0.293042178723


NDVI range @ 1km [-]

0.01

NDVI range @ 2km [-]

0.01

NDVI range @ 5km [-]

0.02

NDVI range @ 10km [-]

0.03

NDVI range @ 20km [-]

0.03


Variance slope @ 1 km

1.01034891377e-05

Variance slope @ 2 km

1.18204892835e-05

Variance slope @ 5 km

9.99784480871e-06

Variance slope @ 10 km

7.18347297012e-06

Variance slope @ 20 km

5.90939503927e-06


NDVI (min. NDVI composite)I


Roman et al. (2009) index


St

8.14212949062

Rcv

0.192871503997

Rse

0.0

Rst

0.007738199504

Rsv

0.167844274473


NDVI range @ 1km [-]

0.01

NDVI range @ 2km [-]

0.01

NDVI range @ 5km [-]

0.02

NDVI range @ 10km [-]

0.02

NDVI range @ 20km [-]

0.02


NDVI slope @ 1 km

3.78108725183e-06

NDVI slope @ 2 km

5.17915122539e-06

NDVI slope @ 5 km

6.09123926984e-06

NDVI slope @ 10 km

4.64792083801e-06

NDVI slope @ 20 km

2.65286235474e-06


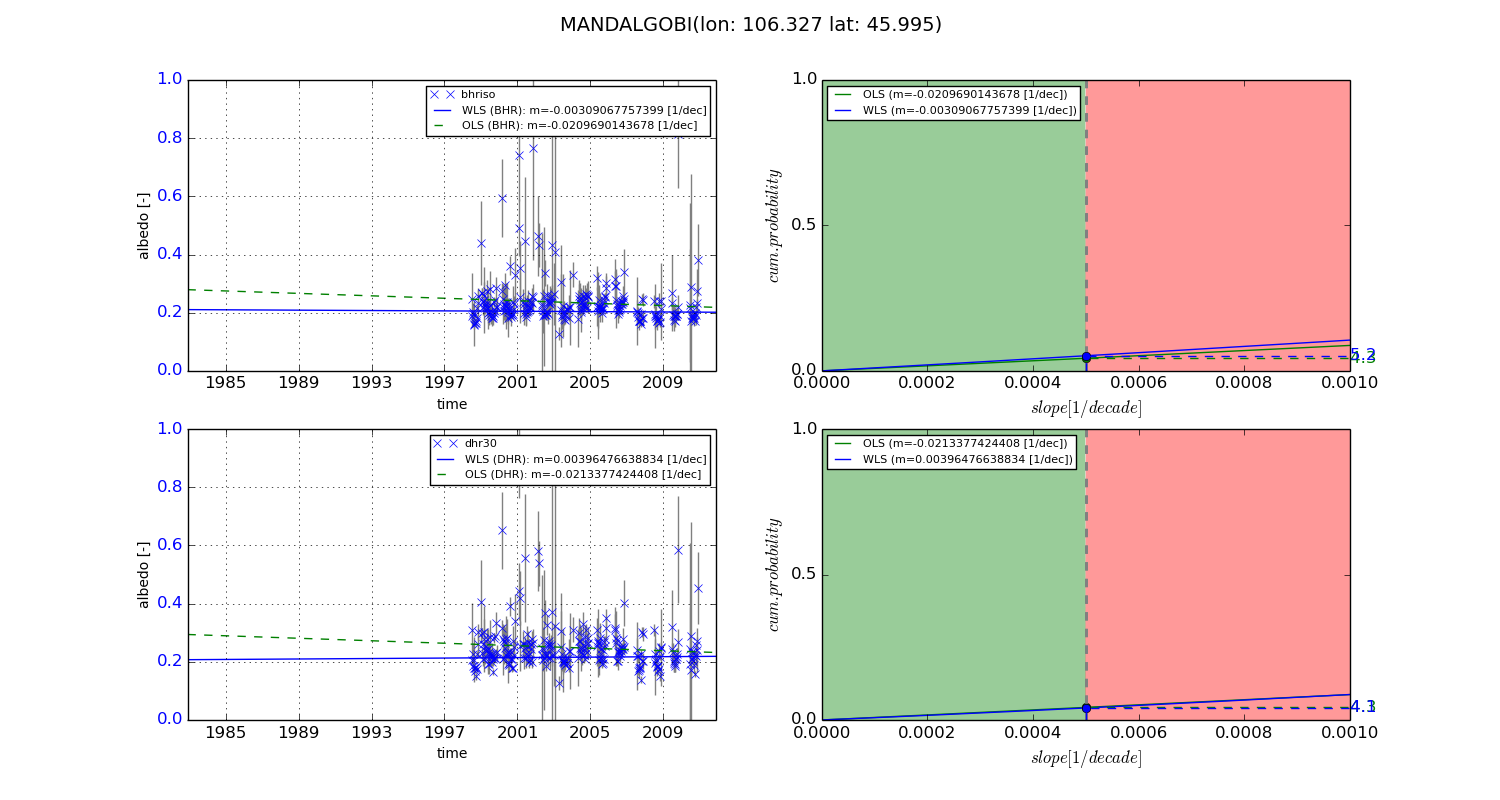
Temporal stability analysis

+000 deg (BHR)


BHR statistics

Temporal stability [1/decade]:


abs

rel


Weighted least square:

None


Ordinary least square:

None


Probabilities that GCOS criteria is met:

Weighted least square:

None %

Ordinary least square:

None %


DHR statistics

Temporal stability [1/decade]:


abs

rel


Weighted least square:

None


Ordinary least square:

None


Probabilities that GCOS criteria is met:

Weighted least square:

None %

Ordinary least square:

None %


+057/+063 deg (BHR)


BHR statistics

Temporal stability [1/decade]:


abs

rel


Weighted least square:

-0.00309067757399


Ordinary least square:

-0.0209690143678


Probabilities that GCOS criteria is met:

Weighted least square:

5.2 %

Ordinary least square:

4.3 %


DHR statistics

Temporal stability [1/decade]:


abs

rel


Weighted least square:

0.00396476638834


Ordinary least square:

-0.0213377424408


Probabilities that GCOS criteria is met:

Weighted least square:

4.1 %

Ordinary least square:

4.3 %


Temporal anomaly analyis

The variance of the temporal anomalies provides an additional measure about the stability of the signal AFTER removal of the mean seasonal cylce.

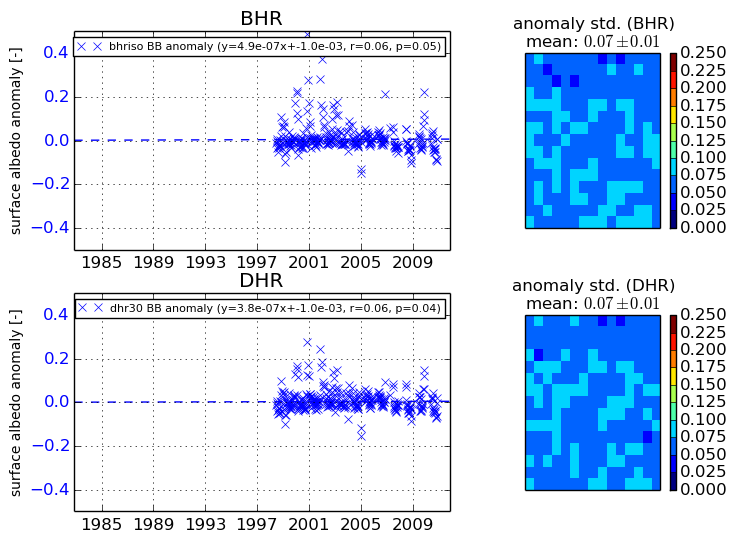
+000 deg


+057/+063 deg