MARTINENI


Location

lon / lat [deg]: 26.08 / 45.92

Source network: ALBEDOVAL2


Geostationary surface albedo (GSA) data


“+000”


“+057/+063”


Landcover information (based on ESA CCI landcover data)


Landcover fractions @ 2km distance


Landcover fractions @ 20 km distance


Legend


Distance to open water bodies [km]:

11.53

Distance to urban areas [km]:

1.23


Radius: 1 km

Number of landcover classes:

2

Dominant landcover type:

10: cropland, rainfed

Fraction of dominant landcover type [%]:

98.0


Radius: 2 km

Number of landcover classes:

3

Dominant landcover type:

10: cropland, rainfed

Fraction of dominant landcover type [%]:

89.0


Radius: 5 km

Number of landcover classes:

2

Dominant landcover type:

10: cropland, rainfed

Fraction of dominant landcover type [%]:

94.0


Radius: 10 km

Number of landcover classes:

4

Dominant landcover type:

10: cropland, rainfed

Fraction of dominant landcover type [%]:

80.0


Radius: 20 km

Number of landcover classes:

6

Dominant landcover type:

10: cropland, rainfed

Fraction of dominant landcover type [%]:

49.0


Disturbances


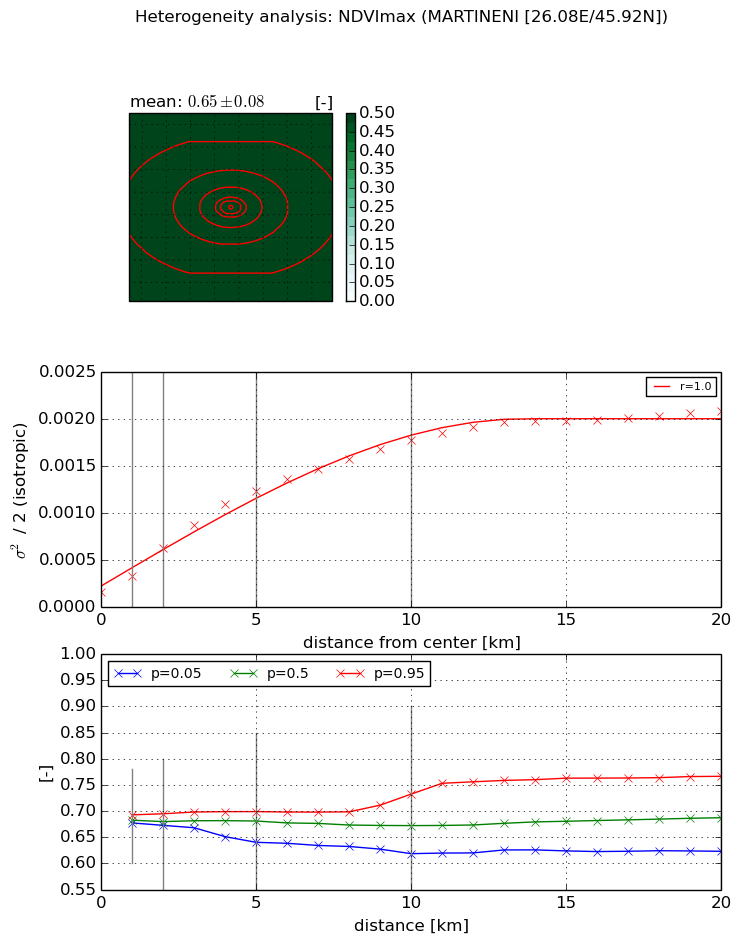
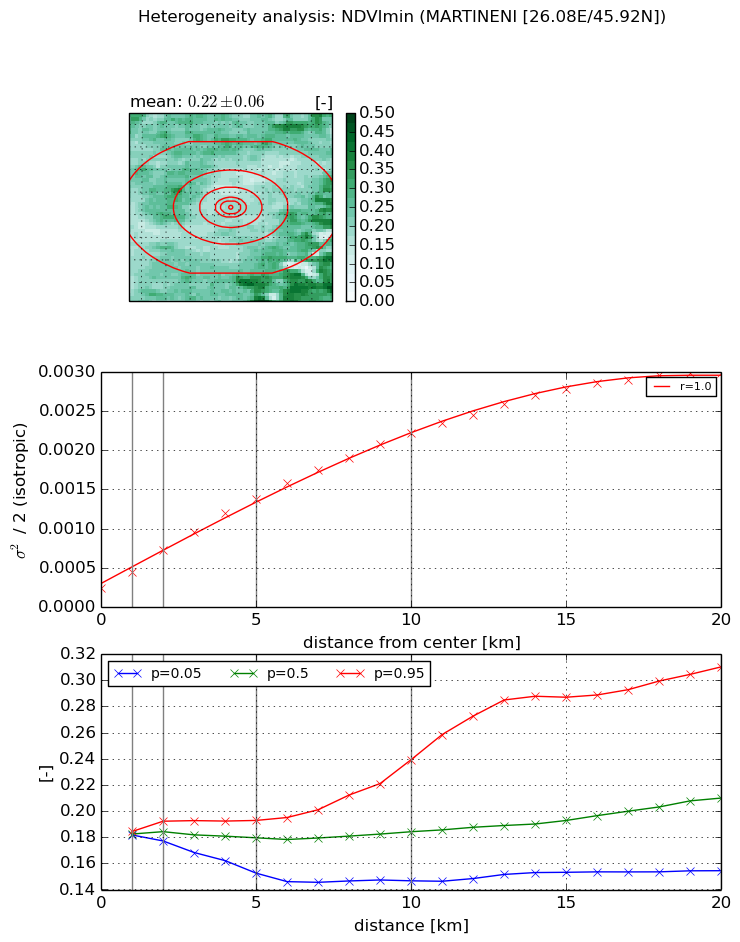
Heterogeneity analysis

The heterogeneity analysis provides information about the spatial and temporal heterogeneity of the site.

Topography


Roman et al. (2009) index


St

4.17226555385

Rcv

0.41615500812

Rse

0.0

Rst

2.17926331794e-05

Rsv

0.302857009842


Height range @ 1km [m]

14

Height range @ 2km [m]

19

Height range @ 5km [m]

31

Height range @ 10km [m]

-999

Height range @ 20km [m]

-999


Variance slope @ 1 km

25

Variance slope @ 2 km

27

Variance slope @ 5 km

31

Variance slope @ 10 km

-999

Variance slope @ 20 km

-999


NDVI (max. NDVI composite)


Roman et al. (2009) index


St

nan

Rcv

nan

Rse

nan

Rst

nan

Rsv

nan


NDVI range @ 1km [-]

0.02

NDVI range @ 2km [-]

0.02

NDVI range @ 5km [-]

0.06

NDVI range @ 10km [-]

0.11

NDVI range @ 20km [-]

0.14


Variance slope @ 1 km

0.000174621441032

Variance slope @ 2 km

0.00023484604086

Variance slope @ 5 km

0.000226278217342

Variance slope @ 10 km

0.000161749997707

Variance slope @ 20 km

8.83116340181e-05


NDVI (min. NDVI composite)I


Roman et al. (2009) index


St

0.44347279894

Rcv

0.799378228733

Rse

0.0

Rst

3.55197204512e-08

Rsv

5.96541093402


NDVI range @ 1km [-]

0.0

NDVI range @ 2km [-]

0.02

NDVI range @ 5km [-]

0.04

NDVI range @ 10km [-]

0.09

NDVI range @ 20km [-]

0.16


NDVI slope @ 1 km

0.000196460631757

NDVI slope @ 2 km

0.000239178521123

NDVI slope @ 5 km

0.000232269769488

NDVI slope @ 10 km

0.000199540461068

NDVI slope @ 20 km

0.000139004165764


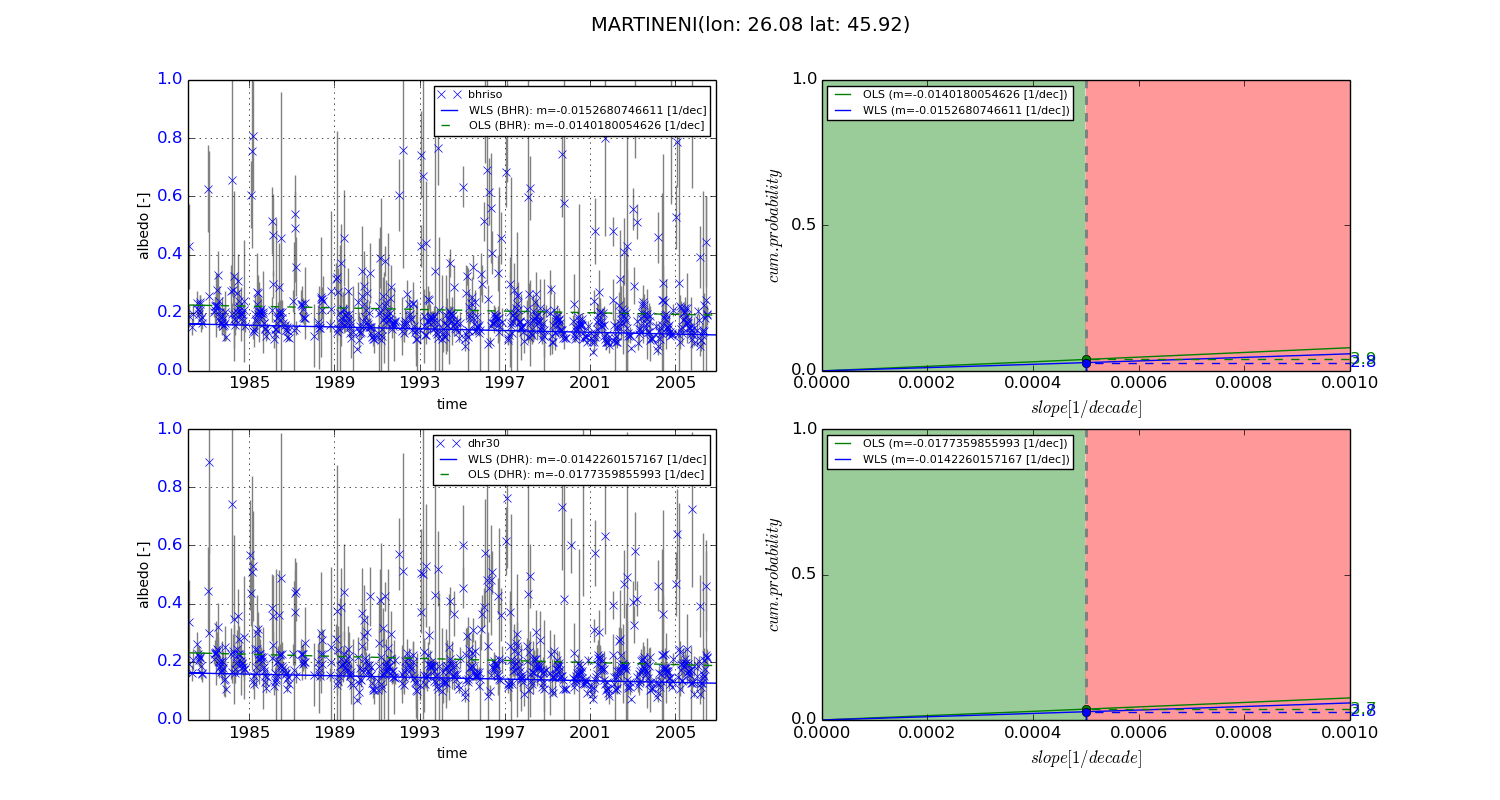
Temporal stability analysis

+000 deg (BHR)


BHR statistics

Temporal stability [1/decade]:


abs

rel


Weighted least square:

-0.0152680746611


Ordinary least square:

-0.0140180054626


Probabilities that GCOS criteria is met:

Weighted least square:

2.8 %

Ordinary least square:

3.9 %


DHR statistics

Temporal stability [1/decade]:


abs

rel


Weighted least square:

-0.0142260157167


Ordinary least square:

-0.0177359855993


Probabilities that GCOS criteria is met:

Weighted least square:

2.8 %

Ordinary least square:

3.7 %


+057/+063 deg (BHR)


BHR statistics

Temporal stability [1/decade]:


abs

rel


Weighted least square:

-0.0261744780028


Ordinary least square:

-0.0285948457556


Probabilities that GCOS criteria is met:

Weighted least square:

3.7 %

Ordinary least square:

4.4 %


DHR statistics

Temporal stability [1/decade]:


abs

rel


Weighted least square:

-0.0249464678567


Ordinary least square:

-0.0191819770632


Probabilities that GCOS criteria is met:

Weighted least square:

3.8 %

Ordinary least square:

4.4 %


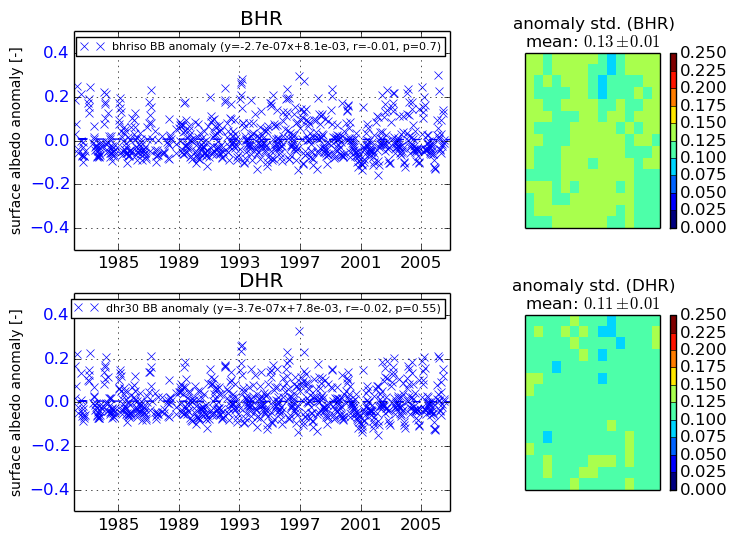
Temporal anomaly analyis

The variance of the temporal anomalies provides an additional measure about the stability of the signal AFTER removal of the mean seasonal cylce.
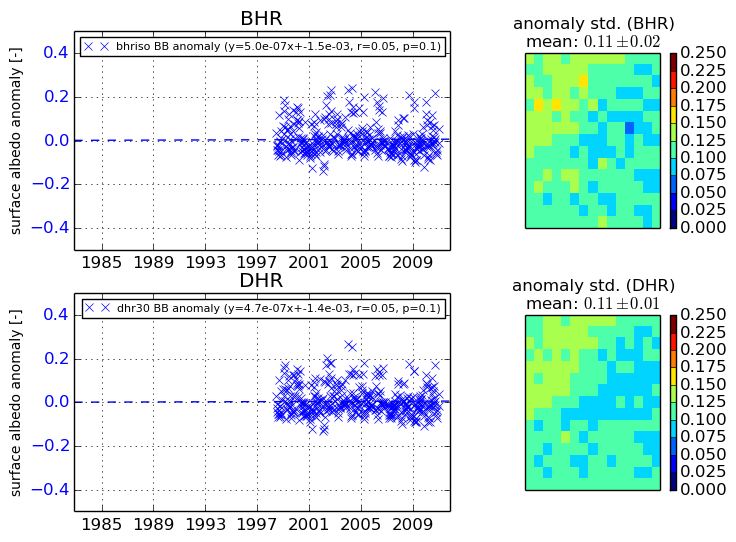
+000 deg


+057/+063 deg