MARTOVA


Location

lon / lat [deg]: 36.953 / 49.936

Source network: AERONET


Geostationary surface albedo (GSA) data


“+000”


“+057/+063”


Landcover information (based on ESA CCI landcover data)


Landcover fractions @ 2km distance


Landcover fractions @ 20 km distance


Legend


Distance to open water bodies [km]:

0.35

Distance to urban areas [km]:

0.19


Radius: 1 km

Number of landcover classes:

4

Dominant landcover type:

210: water bodies

Fraction of dominant landcover type [%]:

55.0


Radius: 2 km

Number of landcover classes:

4

Dominant landcover type:

210: water bodies

Fraction of dominant landcover type [%]:

64.0


Radius: 5 km

Number of landcover classes:

6

Dominant landcover type:

210: water bodies

Fraction of dominant landcover type [%]:

37.0


Radius: 10 km

Number of landcover classes:

6

Dominant landcover type:

10: cropland, rainfed

Fraction of dominant landcover type [%]:

52.0


Radius: 20 km

Number of landcover classes:

5

Dominant landcover type:

10: cropland, rainfed

Fraction of dominant landcover type [%]:

70.0


Disturbances


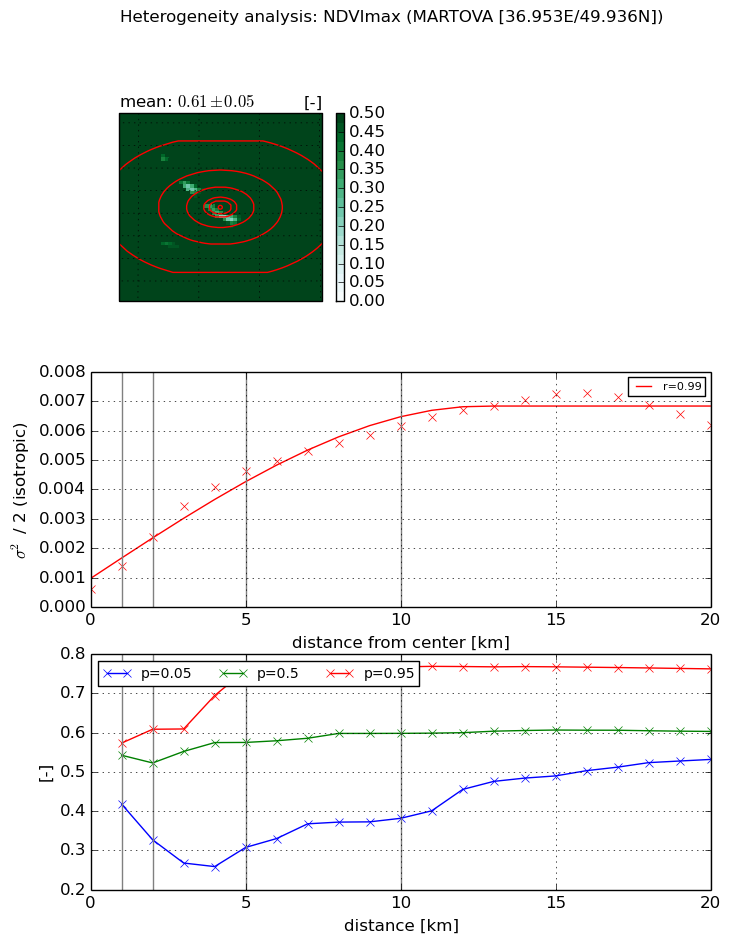
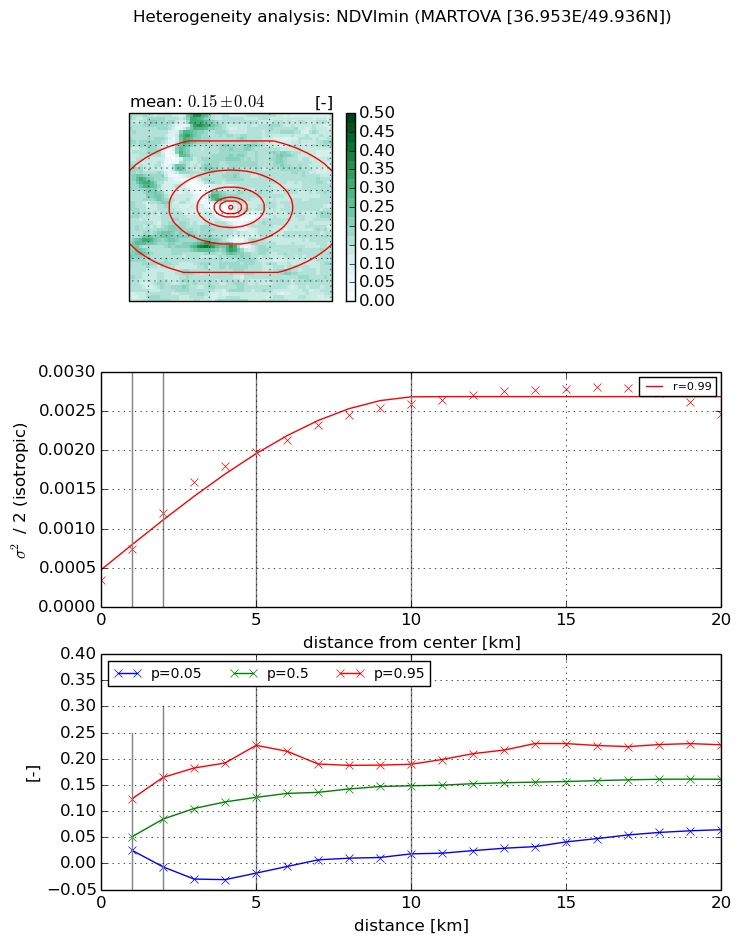
Heterogeneity analysis

The heterogeneity analysis provides information about the spatial and temporal heterogeneity of the site.

Topography


Roman et al. (2009) index


St

1.00700958673e-07

Rcv

0.545684390851

Rse

0.0

Rst

0.0349117074825

Rsv

29791175.5861


Height range @ 1km [m]

18

Height range @ 2km [m]

17

Height range @ 5km [m]

92

Height range @ 10km [m]

-999

Height range @ 20km [m]

-999


Variance slope @ 1 km

235

Variance slope @ 2 km

271

Variance slope @ 5 km

249

Variance slope @ 10 km

-999

Variance slope @ 20 km

-999


NDVI (max. NDVI composite)


Roman et al. (2009) index


St

3.43279118932

Rcv

-0.0802712598827

Rse

0.0

Rst

0.294377349356

Rsv

-0.499275796455


NDVI range @ 1km [-]

0.16

NDVI range @ 2km [-]

0.28

NDVI range @ 5km [-]

0.45

NDVI range @ 10km [-]

0.39

NDVI range @ 20km [-]

0.23


Variance slope @ 1 km

0.000797823045528

Variance slope @ 2 km

0.000897107679467

Variance slope @ 5 km

0.00083421041217

Variance slope @ 10 km

0.00054322578118

Variance slope @ 20 km

0.000276171575557


NDVI (min. NDVI composite)I


Roman et al. (2009) index


St

nan

Rcv

nan

Rse

nan

Rst

nan

Rsv

nan


NDVI range @ 1km [-]

0.1

NDVI range @ 2km [-]

0.17

NDVI range @ 5km [-]

0.24

NDVI range @ 10km [-]

0.17

NDVI range @ 20km [-]

0.16


NDVI slope @ 1 km

0.000390861845275

NDVI slope @ 2 km

0.000426735586192

NDVI slope @ 5 km

0.000335175045072

NDVI slope @ 10 km

0.000217502084205

NDVI slope @ 20 km

9.5189291011e-05


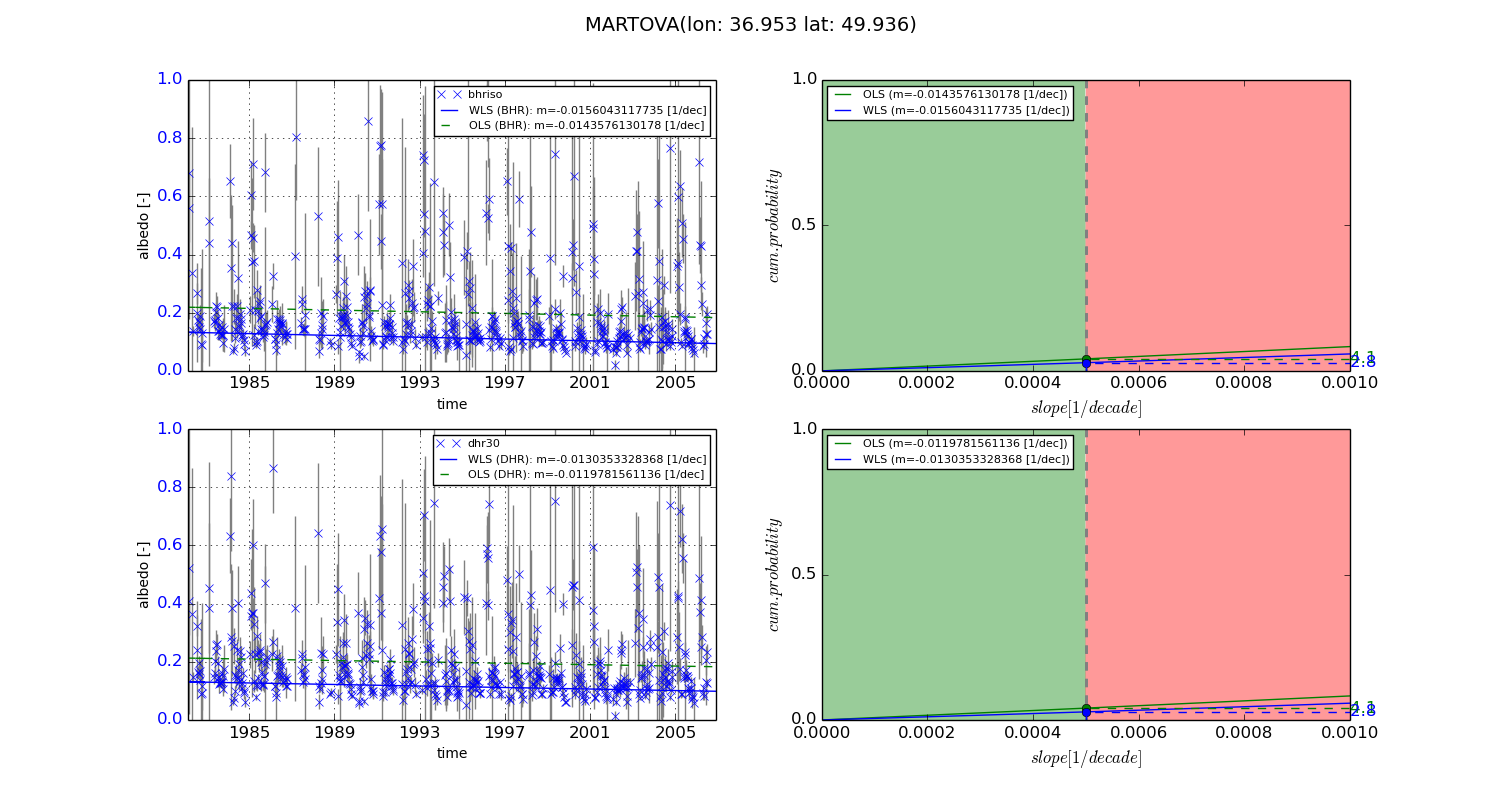
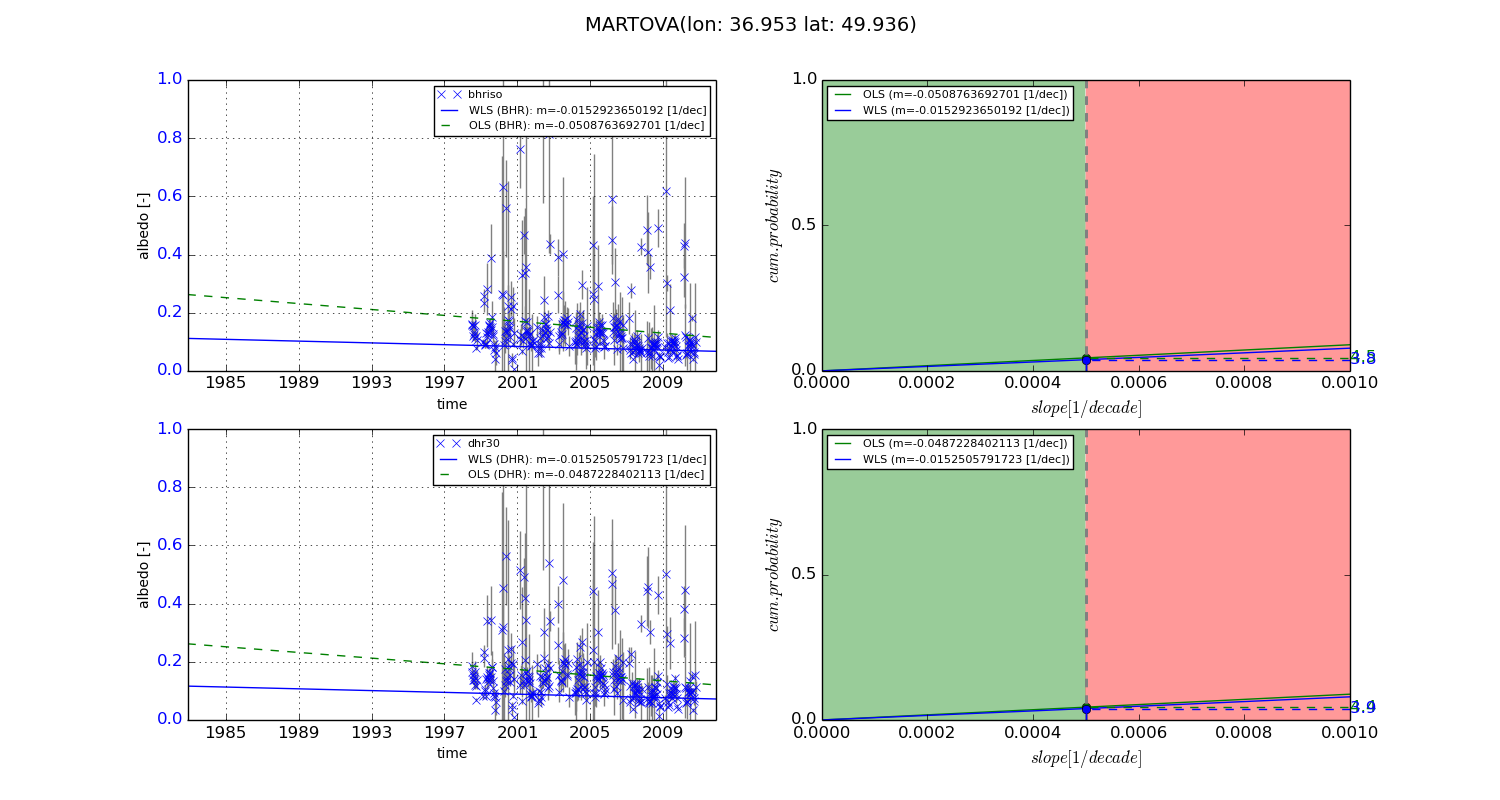
Temporal stability analysis

+000 deg (BHR)


BHR statistics

Temporal stability [1/decade]:


abs

rel


Weighted least square:

-0.0156043117735


Ordinary least square:

-0.0143576130178


Probabilities that GCOS criteria is met:

Weighted least square:

2.8 %

Ordinary least square:

4.1 %


DHR statistics

Temporal stability [1/decade]:


abs

rel


Weighted least square:

-0.0130353328368


Ordinary least square:

-0.0119781561136


Probabilities that GCOS criteria is met:

Weighted least square:

2.8 %

Ordinary least square:

4.1 %


+057/+063 deg (BHR)


BHR statistics

Temporal stability [1/decade]:


abs

rel


Weighted least square:

-0.0152923650192


Ordinary least square:

-0.0508763692701


Probabilities that GCOS criteria is met:

Weighted least square:

3.8 %

Ordinary least square:

4.5 %


DHR statistics

Temporal stability [1/decade]:


abs

rel


Weighted least square:

-0.0152505791723


Ordinary least square:

-0.0487228402113


Probabilities that GCOS criteria is met:

Weighted least square:

3.9 %

Ordinary least square:

4.4 %


Temporal anomaly analyis

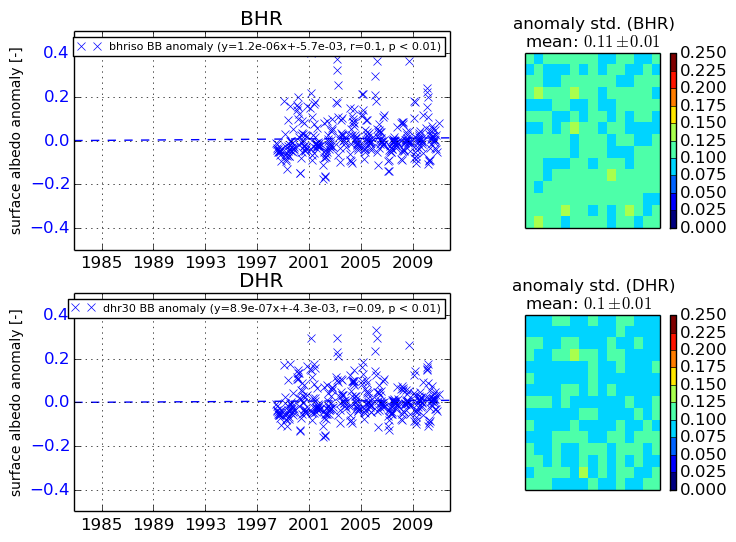
The variance of the temporal anomalies provides an additional measure about the stability of the signal AFTER removal of the mean seasonal cylce.
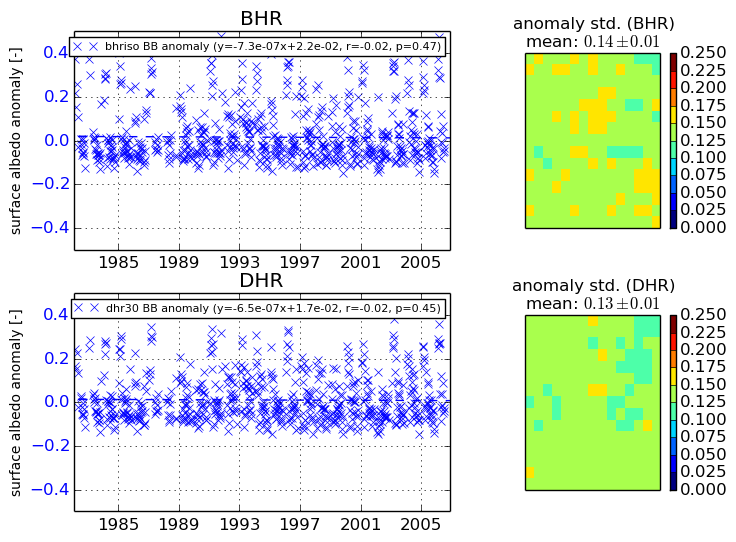
+000 deg


+057/+063 deg