MATANUSKA


Location

lon / lat [deg]: -147.7487 / 61.7769

Source network: AERONET


Geostationary surface albedo (GSA) data


“+000”


“+057/+063”


Landcover information (based on ESA CCI landcover data)


Landcover fractions @ 2km distance


Landcover fractions @ 20 km distance


Legend


Distance to open water bodies [km]:

0.92

Distance to urban areas [km]:

none in region


Radius: 1 km

Number of landcover classes:

4

Dominant landcover type:

220: permanent snow and ice

Fraction of dominant landcover type [%]:

85.0


Radius: 2 km

Number of landcover classes:

8

Dominant landcover type:

220: permanent snow and ice

Fraction of dominant landcover type [%]:

38.0


Radius: 5 km

Number of landcover classes:

11

Dominant landcover type:

100: Mosaic tree and shrub (>50%) / herbaceous cover (<50%)

Fraction of dominant landcover type [%]:

22.0


Radius: 10 km

Number of landcover classes:

11

Dominant landcover type:

100: Mosaic tree and shrub (>50%) / herbaceous cover (<50%)

Fraction of dominant landcover type [%]:

22.0


Radius: 20 km

Number of landcover classes:

11

Dominant landcover type:

200: bare areas

Fraction of dominant landcover type [%]:

24.0


Disturbances


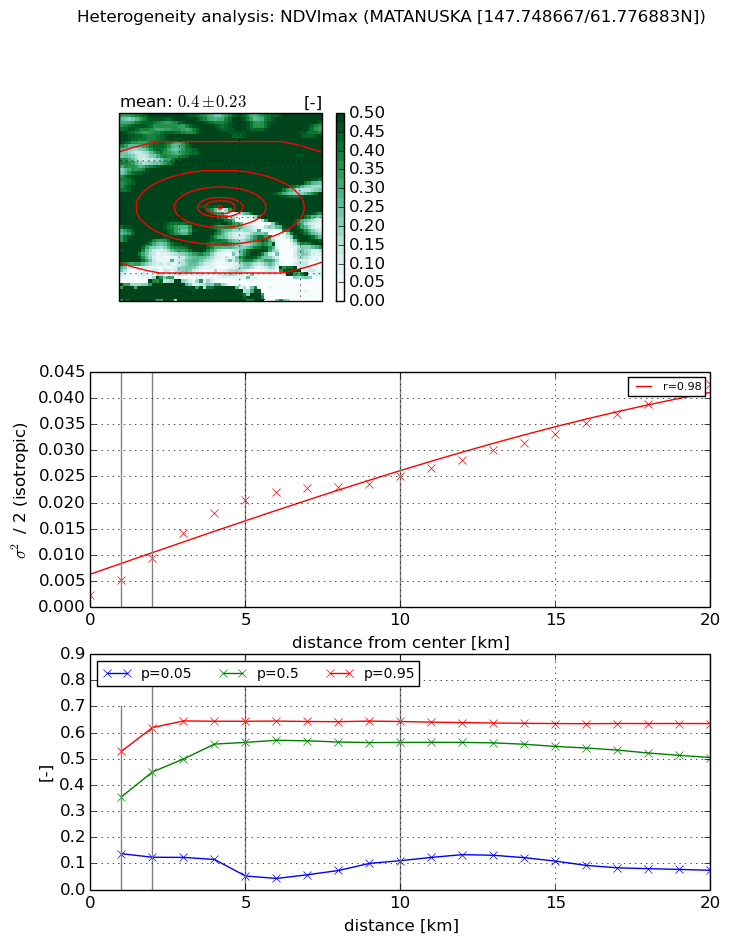
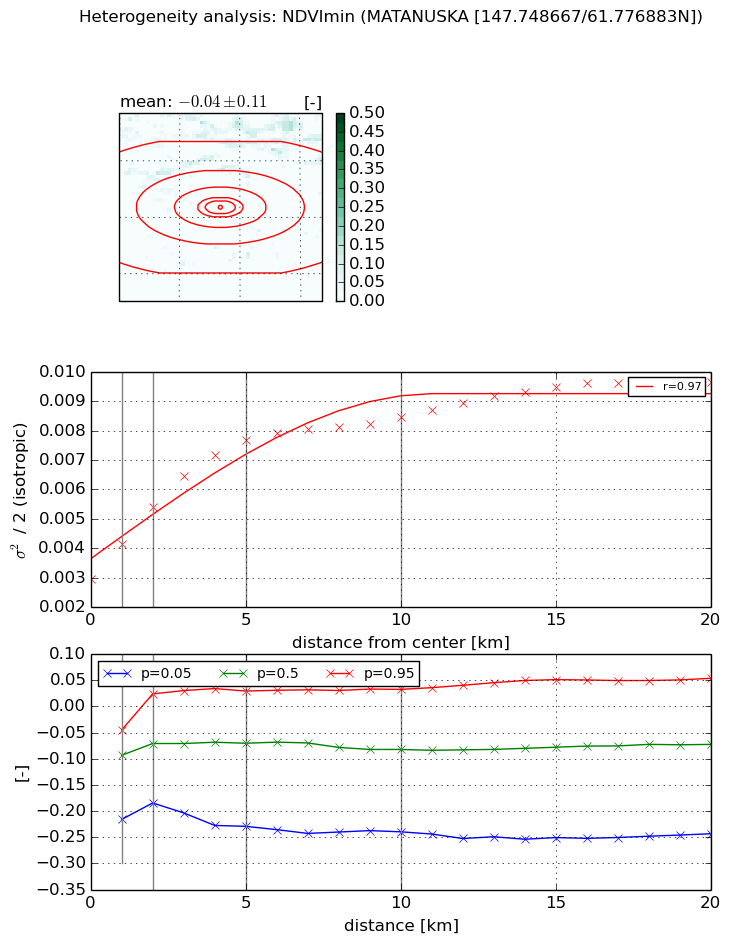
Heterogeneity analysis

The heterogeneity analysis provides information about the spatial and temporal heterogeneity of the site.

Topography


Roman et al. (2009) index


St

2.6552537996

Rcv

0.92917066242

Rse

0.0

Rst

-0.0809969360359

Rsv

-0.119667899926


Height range @ 1km [m]

90

Height range @ 2km [m]

129

Height range @ 5km [m]

610

Height range @ 10km [m]

-999

Height range @ 20km [m]

-999


Variance slope @ 1 km

11252

Variance slope @ 2 km

11325

Variance slope @ 5 km

8990

Variance slope @ 10 km

-999

Variance slope @ 20 km

-999


NDVI (max. NDVI composite)


Roman et al. (2009) index


St

8.92291689296

Rcv

-0.0914762590771

Rse

0.0

Rst

-0.0081967518411

Rsv

0.236539915414


NDVI range @ 1km [-]

0.39

NDVI range @ 2km [-]

0.5

NDVI range @ 5km [-]

0.59

NDVI range @ 10km [-]

0.53

NDVI range @ 20km [-]

0.56


Variance slope @ 1 km

0.00283183069157

Variance slope @ 2 km

0.00350621064509

Variance slope @ 5 km

0.00382536058488

Variance slope @ 10 km

0.00226909409881

Variance slope @ 20 km

0.00176547978504


NDVI (min. NDVI composite)I


Roman et al. (2009) index


St

nan

Rcv

nan

Rse

nan

Rst

nan

Rsv

nan


NDVI range @ 1km [-]

0.17

NDVI range @ 2km [-]

0.21

NDVI range @ 5km [-]

0.26

NDVI range @ 10km [-]

0.27

NDVI range @ 20km [-]

0.3


NDVI slope @ 1 km

0.00116217272576

NDVI slope @ 2 km

0.00121369255742

NDVI slope @ 5 km

0.000965832131664

NDVI slope @ 10 km

0.000509816503593

NDVI slope @ 20 km

0.00026769004837


Temporal stability analysis

+000 deg (BHR)


BHR statistics

Temporal stability [1/decade]:


abs

rel


Weighted least square:

None


Ordinary least square:

None


Probabilities that GCOS criteria is met:

Weighted least square:

None %

Ordinary least square:

None %


DHR statistics

Temporal stability [1/decade]:


abs

rel


Weighted least square:

None


Ordinary least square:

None


Probabilities that GCOS criteria is met:

Weighted least square:

None %

Ordinary least square:

None %


+057/+063 deg (BHR)


BHR statistics

Temporal stability [1/decade]:


abs

rel


Weighted least square:

None


Ordinary least square:

None


Probabilities that GCOS criteria is met:

Weighted least square:

None %

Ordinary least square:

None %


DHR statistics

Temporal stability [1/decade]:


abs

rel


Weighted least square:

None


Ordinary least square:

None


Probabilities that GCOS criteria is met:

Weighted least square:

None %

Ordinary least square:

None %


Temporal anomaly analyis

The variance of the temporal anomalies provides an additional measure about the stability of the signal AFTER removal of the mean seasonal cylce.

+000 deg


+057/+063 deg