MAUN_TOWER


Location

lon / lat [deg]: 23.55 / -19.9

Source network: AERONET


Geostationary surface albedo (GSA) data


“+000”


“+057/+063”


Landcover information (based on ESA CCI landcover data)


Landcover fractions @ 2km distance


Landcover fractions @ 20 km distance


Legend


Distance to open water bodies [km]:

40.01

Distance to urban areas [km]:

14.27


Radius: 1 km

Number of landcover classes:

2

Dominant landcover type:

10: cropland, rainfed

Fraction of dominant landcover type [%]:

78.0


Radius: 2 km

Number of landcover classes:

5

Dominant landcover type:

10: cropland, rainfed

Fraction of dominant landcover type [%]:

78.0


Radius: 5 km

Number of landcover classes:

6

Dominant landcover type:

10: cropland, rainfed

Fraction of dominant landcover type [%]:

60.0


Radius: 10 km

Number of landcover classes:

6

Dominant landcover type:

10: cropland, rainfed

Fraction of dominant landcover type [%]:

47.0


Radius: 20 km

Number of landcover classes:

6

Dominant landcover type:

10: cropland, rainfed

Fraction of dominant landcover type [%]:

38.0


Disturbances


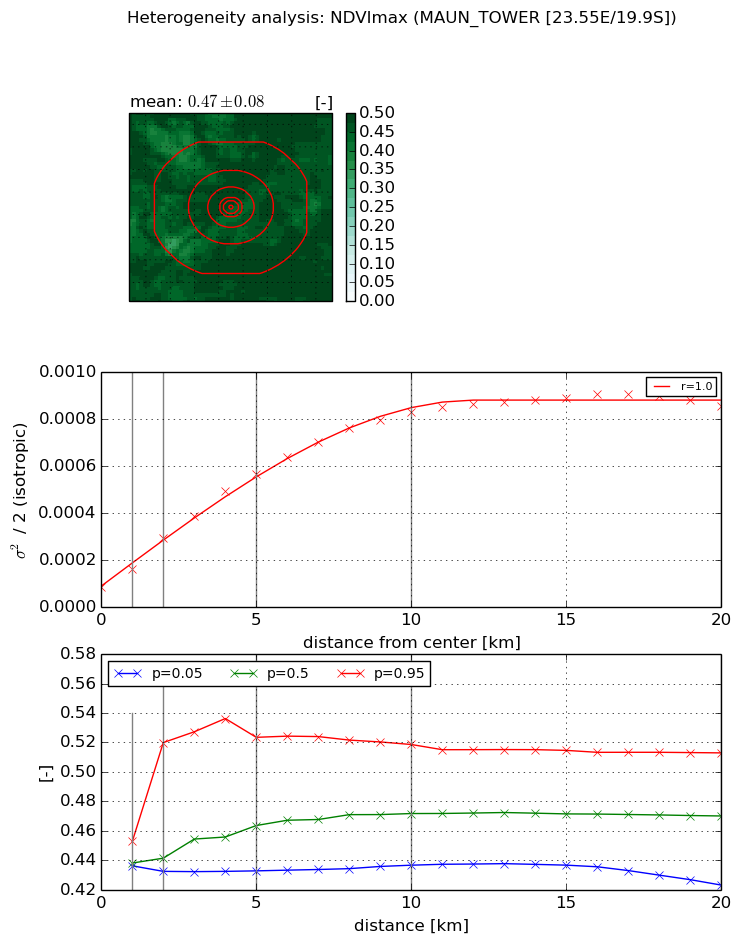
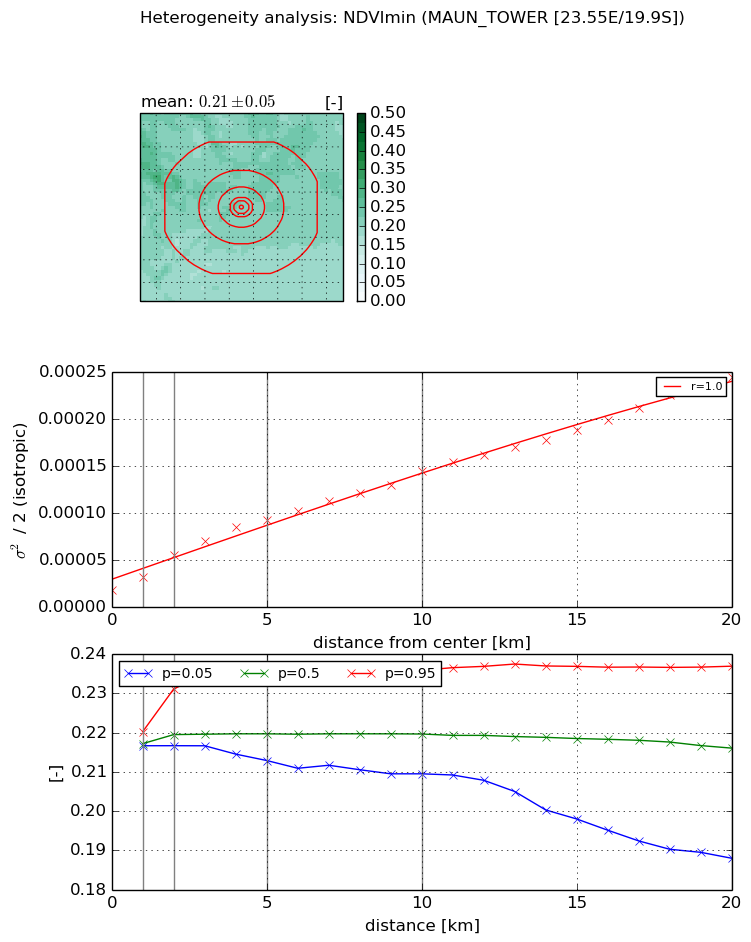
Heterogeneity analysis

The heterogeneity analysis provides information about the spatial and temporal heterogeneity of the site.

Topography


Roman et al. (2009) index


St

2.77991540173

Rcv

0.0442883833392

Rse

0.0

Rst

-0.0348811952428

Rsv

-0.999999952307


Height range @ 1km [m]

6

Height range @ 2km [m]

15

Height range @ 5km [m]

15

Height range @ 10km [m]

-999

Height range @ 20km [m]

-999


Variance slope @ 1 km

5

Variance slope @ 2 km

4

Variance slope @ 5 km

4

Variance slope @ 10 km

-999

Variance slope @ 20 km

-999


NDVI (max. NDVI composite)


Roman et al. (2009) index


St

1.46691044253e-05

Rcv

-0.0624992805117

Rse

0.0

Rst

0.277615726758

Rsv

204511.122414


NDVI range @ 1km [-]

0.02

NDVI range @ 2km [-]

0.09

NDVI range @ 5km [-]

0.09

NDVI range @ 10km [-]

0.08

NDVI range @ 20km [-]

0.09


Variance slope @ 1 km

7.40176319344e-05

Variance slope @ 2 km

0.000102988728188

Variance slope @ 5 km

9.93797341548e-05

Variance slope @ 10 km

7.66198604206e-05

Variance slope @ 20 km

3.70124355458e-05


NDVI (min. NDVI composite)I


Roman et al. (2009) index


St

nan

Rcv

nan

Rse

nan

Rst

nan

Rsv

nan


NDVI range @ 1km [-]

0.0

NDVI range @ 2km [-]

0.01

NDVI range @ 5km [-]

0.02

NDVI range @ 10km [-]

0.03

NDVI range @ 20km [-]

0.05


NDVI slope @ 1 km

1.45262198385e-05

NDVI slope @ 2 km

1.89519657378e-05

NDVI slope @ 5 km

1.5631089373e-05

NDVI slope @ 10 km

1.20546624257e-05

NDVI slope @ 20 km

1.05992142225e-05


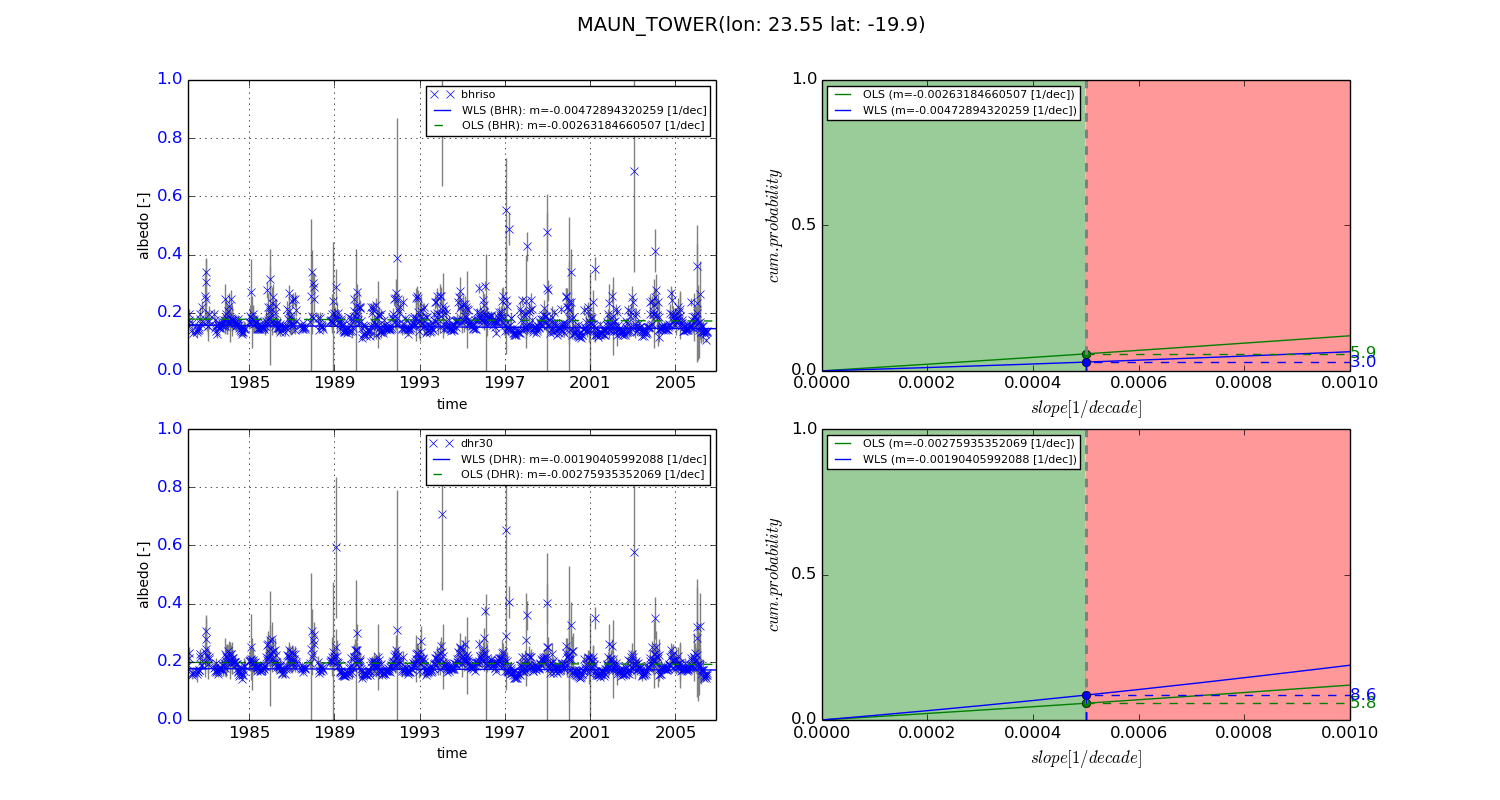
Temporal stability analysis

+000 deg (BHR)


BHR statistics

Temporal stability [1/decade]:


abs

rel


Weighted least square:

-0.00472894320259


Ordinary least square:

-0.00263184660507


Probabilities that GCOS criteria is met:

Weighted least square:

3.0 %

Ordinary least square:

5.9 %


DHR statistics

Temporal stability [1/decade]:


abs

rel


Weighted least square:

-0.00190405992088


Ordinary least square:

-0.00275935352069


Probabilities that GCOS criteria is met:

Weighted least square:

8.6 %

Ordinary least square:

5.8 %


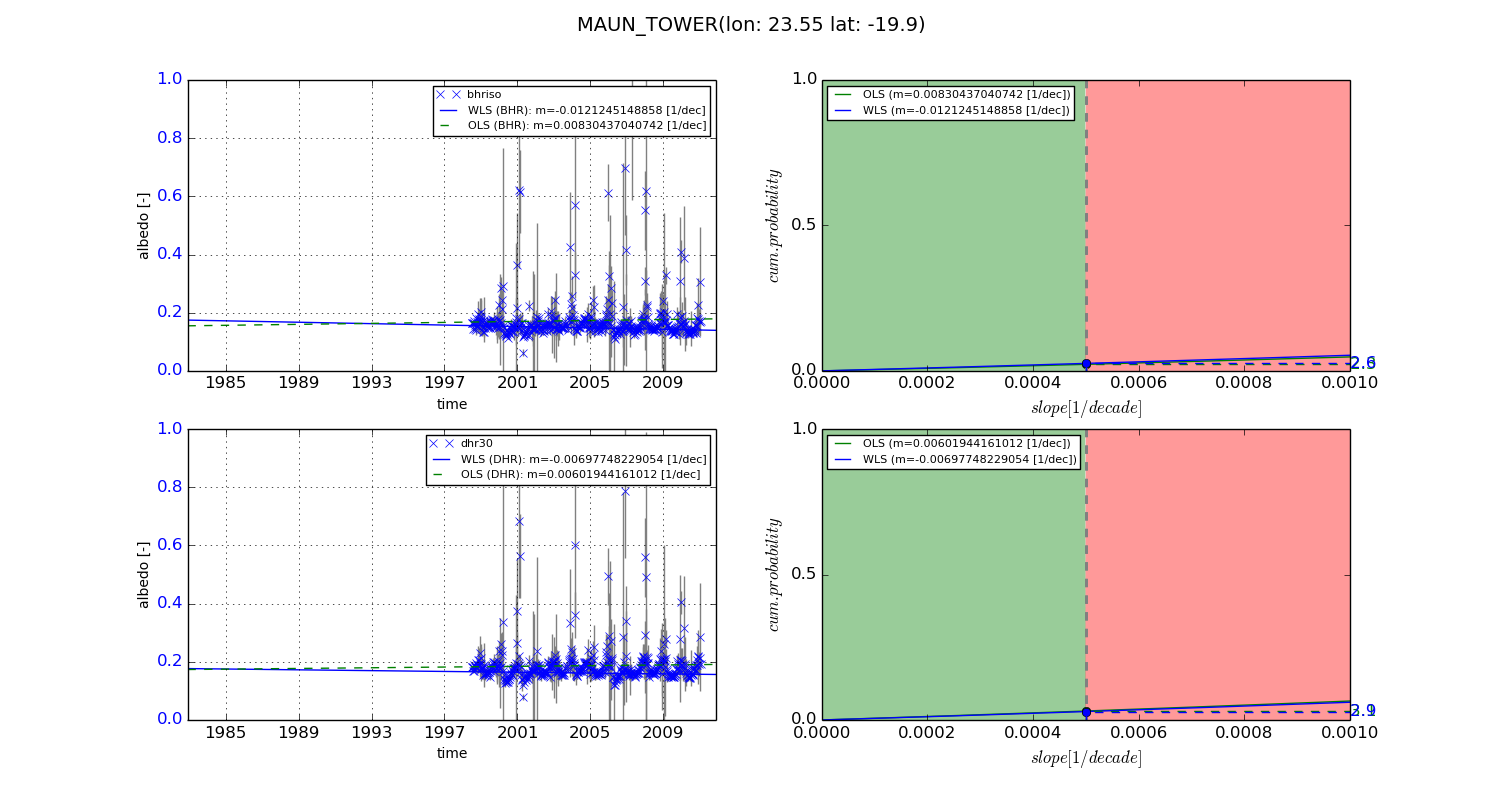
+057/+063 deg (BHR)


BHR statistics

Temporal stability [1/decade]:


abs

rel


Weighted least square:

-0.0121245148858


Ordinary least square:

0.00830437040742


Probabilities that GCOS criteria is met:

Weighted least square:

2.6 %

Ordinary least square:

2.3 %


DHR statistics

Temporal stability [1/decade]:


abs

rel


Weighted least square:

-0.00697748229054


Ordinary least square:

0.00601944161012


Probabilities that GCOS criteria is met:

Weighted least square:

2.9 %

Ordinary least square:

3.1 %


Temporal anomaly analyis

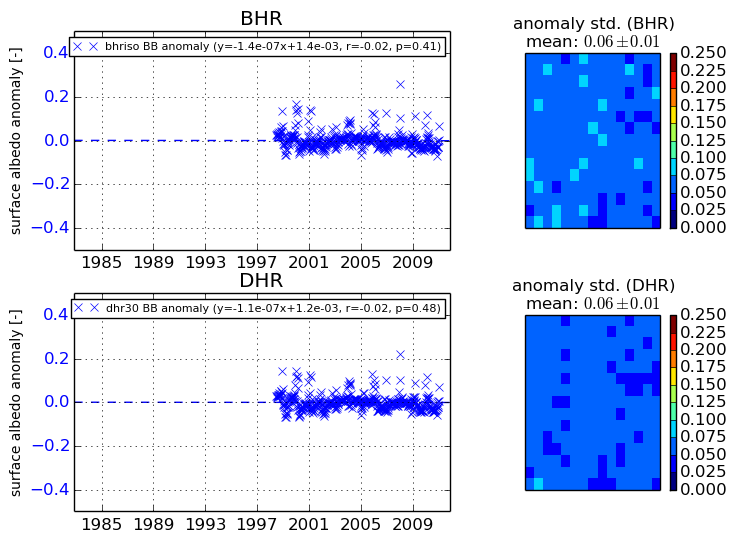
The variance of the temporal anomalies provides an additional measure about the stability of the signal AFTER removal of the mean seasonal cylce.
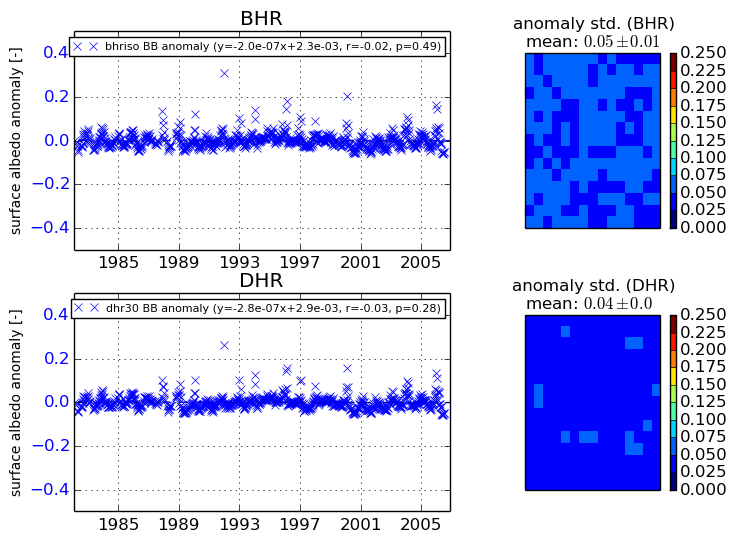
+000 deg


+057/+063 deg