MEDELLIN


Location

lon / lat [deg]: -75.5779 / 6.2607

Source network: AERONET


Geostationary surface albedo (GSA) data


“+000”


“+057/+063”


Landcover information (based on ESA CCI landcover data)


Landcover fractions @ 2km distance


Landcover fractions @ 20 km distance


Legend


Distance to open water bodies [km]:

18.72

Distance to urban areas [km]:

0.17


Radius: 1 km

Number of landcover classes:

1

Dominant landcover type:

190: urban areas

Fraction of dominant landcover type [%]:

100.0


Radius: 2 km

Number of landcover classes:

1

Dominant landcover type:

190: urban areas

Fraction of dominant landcover type [%]:

100.0


Radius: 5 km

Number of landcover classes:

3

Dominant landcover type:

190: urban areas

Fraction of dominant landcover type [%]:

95.0


Radius: 10 km

Number of landcover classes:

7

Dominant landcover type:

190: urban areas

Fraction of dominant landcover type [%]:

51.0


Radius: 20 km

Number of landcover classes:

9

Dominant landcover type:

50: Tree cover, broadleaved, evergreen, closed to open (>15%)

Fraction of dominant landcover type [%]:

39.0


Disturbances


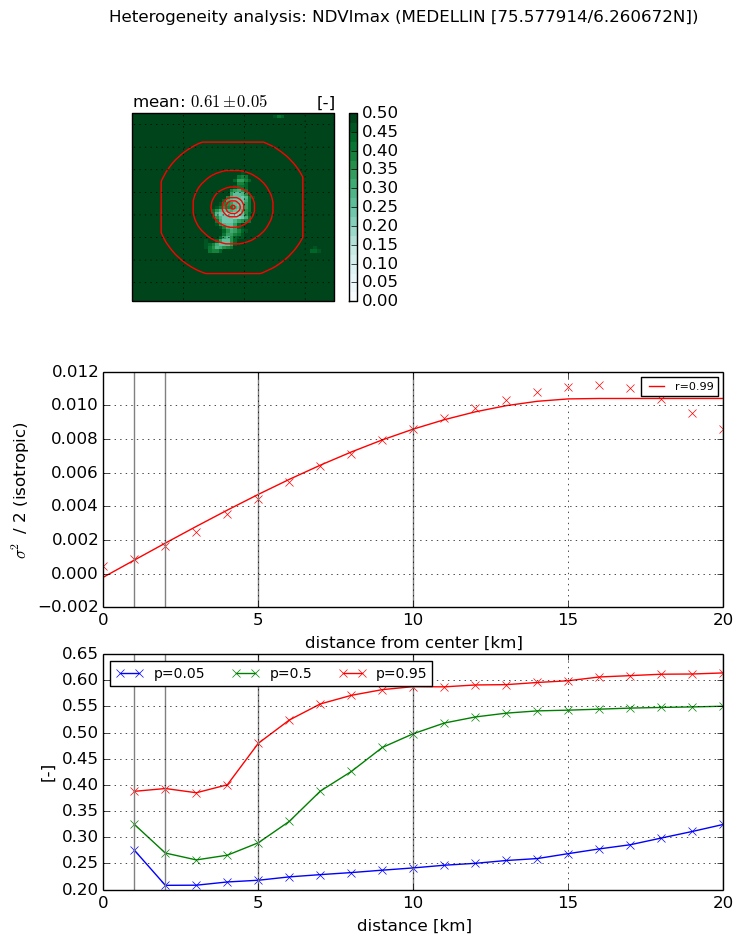
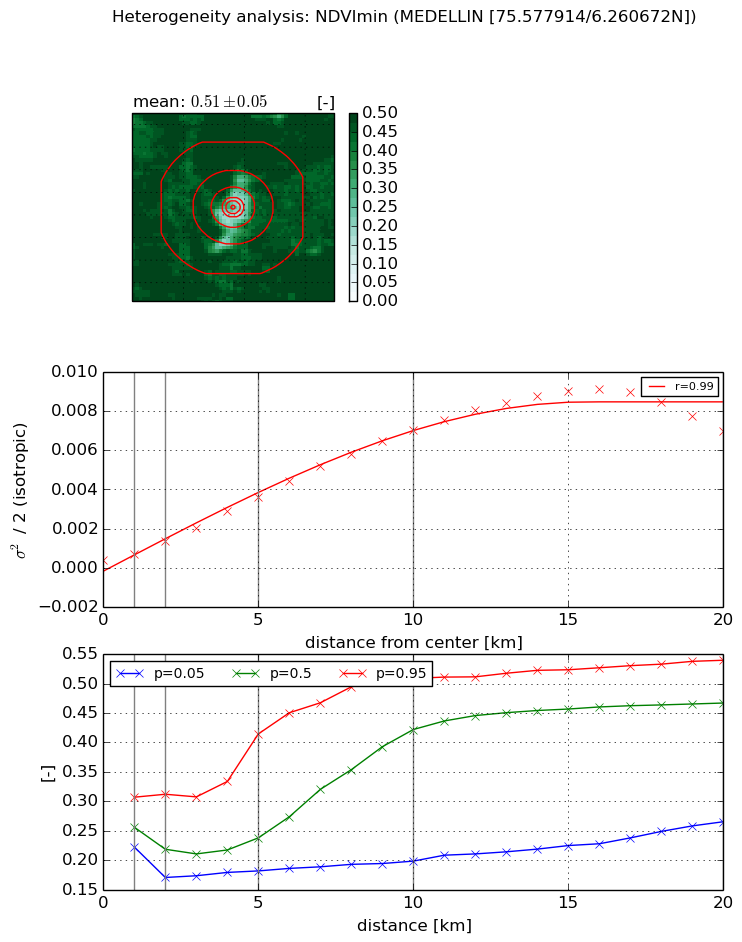
Heterogeneity analysis

The heterogeneity analysis provides information about the spatial and temporal heterogeneity of the site.

Topography


Roman et al. (2009) index


St

1.0177856575

Rcv

2.41156463149

Rse

0.0

Rst

0.0790293929968

Rsv

0.456981408393


Height range @ 1km [m]

100

Height range @ 2km [m]

76

Height range @ 5km [m]

495

Height range @ 10km [m]

-999

Height range @ 20km [m]

-999


Variance slope @ 1 km

7008

Variance slope @ 2 km

10745

Variance slope @ 5 km

11895

Variance slope @ 10 km

-999

Variance slope @ 20 km

-999


NDVI (max. NDVI composite)


Roman et al. (2009) index


St

2.33189078432

Rcv

0.294958822005

Rse

0.0

Rst

-0.196750272222

Rsv

0.794800557158


NDVI range @ 1km [-]

0.11

NDVI range @ 2km [-]

0.19

NDVI range @ 5km [-]

0.26

NDVI range @ 10km [-]

0.35

NDVI range @ 20km [-]

0.29


Variance slope @ 1 km

0.00041769564716

Variance slope @ 2 km

0.000610188771381

Variance slope @ 5 km

0.000824923254012

Variance slope @ 10 km

0.000862601959833

Variance slope @ 20 km

0.000530565973709


NDVI (min. NDVI composite)I


Roman et al. (2009) index


St

1.78018485796

Rcv

0.412118293032

Rse

0.0

Rst

-0.288959926286

Rsv

0.984140024501


NDVI range @ 1km [-]

0.08

NDVI range @ 2km [-]

0.14

NDVI range @ 5km [-]

0.23

NDVI range @ 10km [-]

0.31

NDVI range @ 20km [-]

0.27


NDVI slope @ 1 km

0.00033704778363

NDVI slope @ 2 km

0.000493492935619

NDVI slope @ 5 km

0.000668663222486

NDVI slope @ 10 km

0.000703061396255

NDVI slope @ 20 km

0.000430405694316


Temporal stability analysis

+000 deg (BHR)


BHR statistics

Temporal stability [1/decade]:


abs

rel


Weighted least square:

-99999.0


Ordinary least square:

-99999.0


Probabilities that GCOS criteria is met:

Weighted least square:

-99999.0 %

Ordinary least square:

-99999.0 %


DHR statistics

Temporal stability [1/decade]:


abs

rel


Weighted least square:

-99999.0


Ordinary least square:

-99999.0


Probabilities that GCOS criteria is met:

Weighted least square:

-99999.0 %

Ordinary least square:

-99999.0 %


+057/+063 deg (BHR)


BHR statistics

Temporal stability [1/decade]:


abs

rel


Weighted least square:

None


Ordinary least square:

None


Probabilities that GCOS criteria is met:

Weighted least square:

None %

Ordinary least square:

None %


DHR statistics

Temporal stability [1/decade]:


abs

rel


Weighted least square:

None


Ordinary least square:

None


Probabilities that GCOS criteria is met:

Weighted least square:

None %

Ordinary least square:

None %


Temporal anomaly analyis

The variance of the temporal anomalies provides an additional measure about the stability of the signal AFTER removal of the mean seasonal cylce.

+000 deg


+057/+063 deg