MERREDIN


Location

lon / lat [deg]: 118.2264 / -31.4931

Source network: AERONET


Geostationary surface albedo (GSA) data


“+000”


“+057/+063”


Landcover information (based on ESA CCI landcover data)


Landcover fractions @ 2km distance


Landcover fractions @ 20 km distance


Legend


Distance to open water bodies [km]:

12.66

Distance to urban areas [km]:

42.77


Radius: 1 km

Number of landcover classes:

6

Dominant landcover type:

10: cropland, rainfed

Fraction of dominant landcover type [%]:

35.0


Radius: 2 km

Number of landcover classes:

7

Dominant landcover type:

30: mosaic cropland (>50%), natural veg. (< 50%)

Fraction of dominant landcover type [%]:

41.0


Radius: 5 km

Number of landcover classes:

6

Dominant landcover type:

10: cropland, rainfed

Fraction of dominant landcover type [%]:

40.0


Radius: 10 km

Number of landcover classes:

8

Dominant landcover type:

10: cropland, rainfed

Fraction of dominant landcover type [%]:

44.0


Radius: 20 km

Number of landcover classes:

8

Dominant landcover type:

10: cropland, rainfed

Fraction of dominant landcover type [%]:

50.0


Disturbances


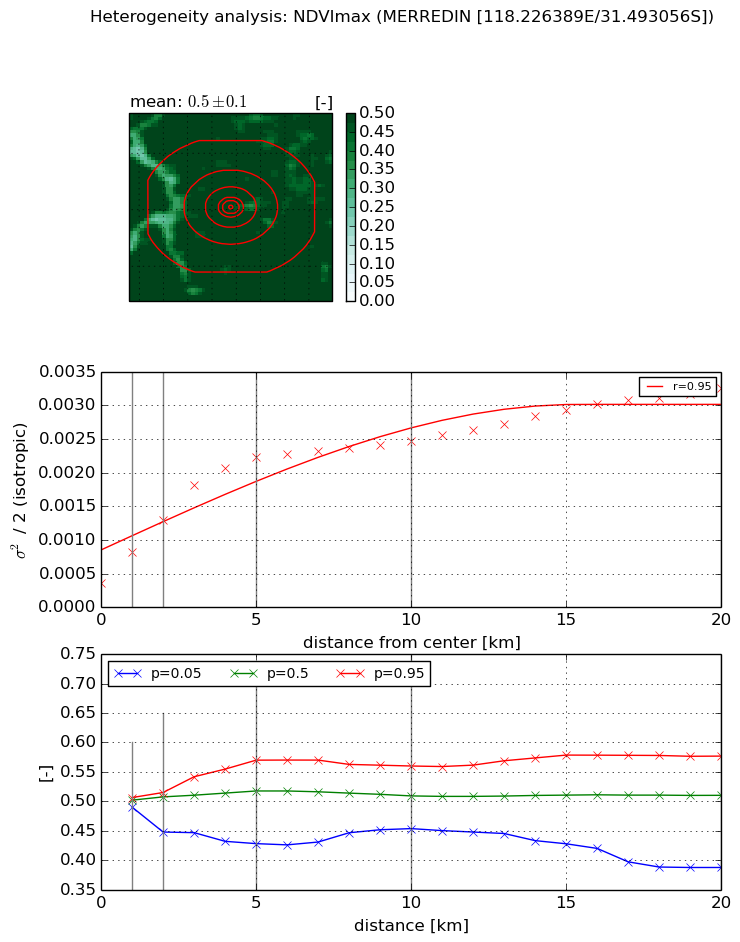
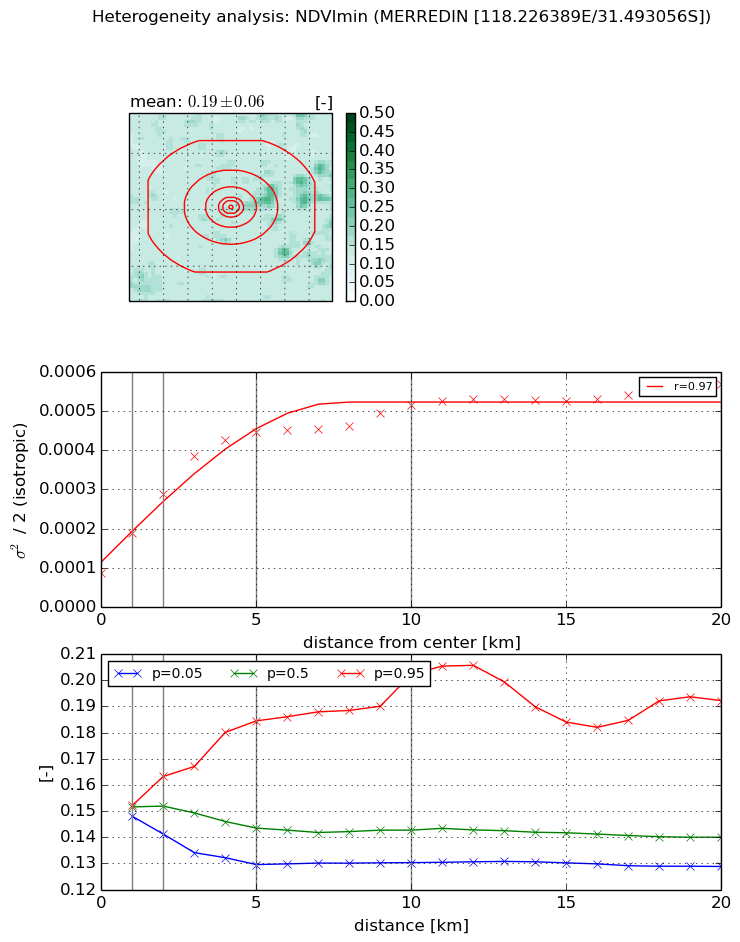
Heterogeneity analysis

The heterogeneity analysis provides information about the spatial and temporal heterogeneity of the site.

Topography


Roman et al. (2009) index


St

3.66919017551

Rcv

0.411999911231

Rse

0.0

Rst

0.0237051680443

Rsv

0.381914029165


Height range @ 1km [m]

6

Height range @ 2km [m]

20

Height range @ 5km [m]

54

Height range @ 10km [m]

-999

Height range @ 20km [m]

-999


Variance slope @ 1 km

50

Variance slope @ 2 km

70

Variance slope @ 5 km

66

Variance slope @ 10 km

-999

Variance slope @ 20 km

-999


NDVI (max. NDVI composite)


Roman et al. (2009) index


St

2.3653389088

Rcv

0.320234551048

Rse

0.0

Rst

-0.146119435135

Rsv

0.801963204574


NDVI range @ 1km [-]

0.02

NDVI range @ 2km [-]

0.07

NDVI range @ 5km [-]

0.14

NDVI range @ 10km [-]

0.11

NDVI range @ 20km [-]

0.19


Variance slope @ 1 km

0.000460234900437

Variance slope @ 2 km

0.000472446633166

Variance slope @ 5 km

0.000389774539098

Variance slope @ 10 km

0.000194352351191

Variance slope @ 20 km

0.000112800023704


NDVI (min. NDVI composite)I


Roman et al. (2009) index


St

2.33283541004

Rcv

0.41043087338

Rse

0.0

Rst

-0.127994033606

Rsv

0.747563803184


NDVI range @ 1km [-]

0.0

NDVI range @ 2km [-]

0.02

NDVI range @ 5km [-]

0.05

NDVI range @ 10km [-]

0.07

NDVI range @ 20km [-]

0.06


NDVI slope @ 1 km

0.000102735631414

NDVI slope @ 2 km

0.000101524333858

NDVI slope @ 5 km

7.4325076599e-05

NDVI slope @ 10 km

3.67845102423e-05

NDVI slope @ 20 km

1.69994294112e-05


Temporal stability analysis

+000 deg (BHR)


BHR statistics

Temporal stability [1/decade]:


abs

rel


Weighted least square:

None


Ordinary least square:

None


Probabilities that GCOS criteria is met:

Weighted least square:

None %

Ordinary least square:

None %


DHR statistics

Temporal stability [1/decade]:


abs

rel


Weighted least square:

None


Ordinary least square:

None


Probabilities that GCOS criteria is met:

Weighted least square:

None %

Ordinary least square:

None %


+057/+063 deg (BHR)


BHR statistics

Temporal stability [1/decade]:


abs

rel


Weighted least square:

-99999.0


Ordinary least square:

-99999.0


Probabilities that GCOS criteria is met:

Weighted least square:

-99999.0 %

Ordinary least square:

-99999.0 %


DHR statistics

Temporal stability [1/decade]:


abs

rel


Weighted least square:

-99999.0


Ordinary least square:

-99999.0


Probabilities that GCOS criteria is met:

Weighted least square:

-99999.0 %

Ordinary least square:

-99999.0 %


Temporal anomaly analyis

The variance of the temporal anomalies provides an additional measure about the stability of the signal AFTER removal of the mean seasonal cylce.

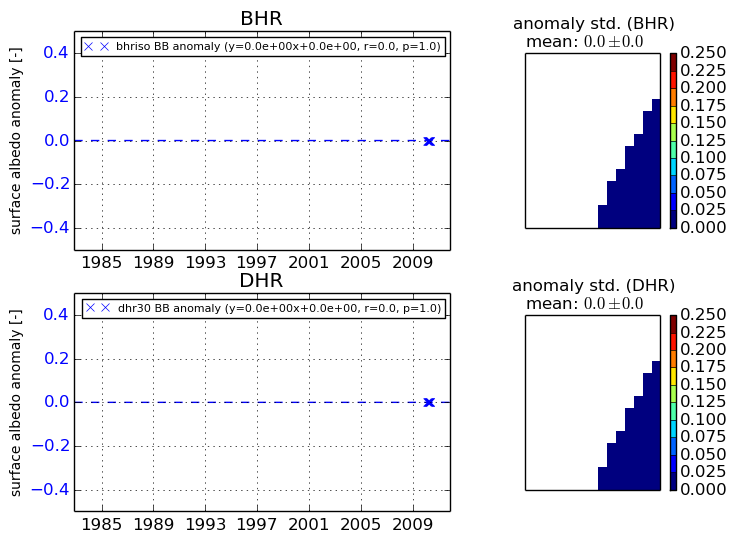
+000 deg


+057/+063 deg